Hey,
In August, I started a discussion (see concourse/concourse#4247) on whether Concourse should drop the implementation of metrics emission for various providers (e.g., NewRelic, DataDog, Riemann etc) in favor of just making itself observable via an endpoint serving its counters, gauges, etc via the openmetrics format.
It was interesting how that surfaced that by doing so, we’d essentially be dropping support for something that people rely on, that I pretty much overlooked: very precise timing of when a build started, finished. That’s because by moving to a pull-based approach without any real exposition of events would make that virtually impossible.
event emission

        concourse
                t0 --------> datadog
                       "yo, just got a build finished right now!"
                                team="ux" pipeline="frontend" job="yarn"

                t1 --------> datadog
                       "hey, another build!!"

                ...


pull-based metric retrieval

        concourse
                <----------- prometheus
                      "hey, how many successful did you have so far?"

                <----------- prometheus
                      "hey, how many successful did you have so far?"

                ...
However, there’s something that is pretty good for high cardinality events with precise timing: distributed tracing tools.
Nat Bennett had already created an issue about this approach (see concourse/concourse#3958) highlighting how that’d be a great addition for Concourse, so, why not give it a try?
Table of Contents
what we’d like to reach
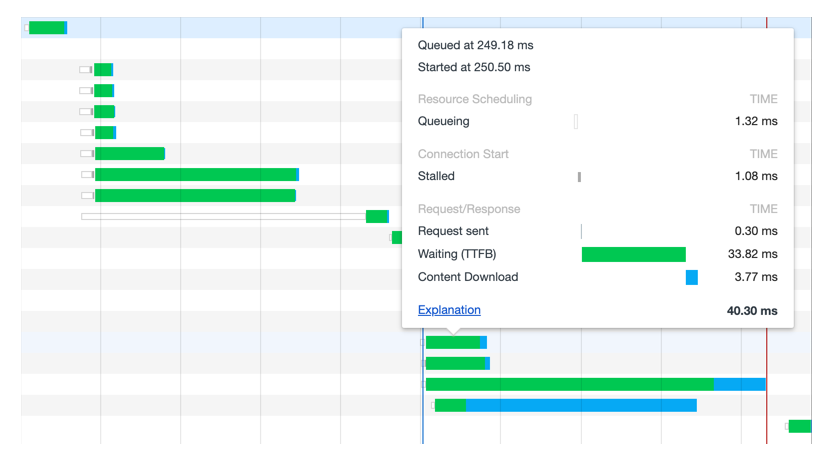
If you’ve ever seen the how browsers display a breakdown of the requests that took place to load a page, yeah, that’s what we’re aiming for.
Now, imagine that thing being the way that you visualize the build of one of your jobs. The build representing the entirety of some chunk of time, which can then be decomposed in all of the steps that took place to complete it.
Or, even better, not only representing how long each step took, but where it failed, for which reason, on which worker, for which team, with which inputs, and so on and so forth.
Continuing with that goal in mind, let’s consider the following Concourse pipeline:
jobs:
- name: build-golang-builder-image
  plan:
  - in_parallel:
    - {get: ci}
    - {get: oci-build-task}
    - {get: golang-linux, trigger: true}

  - task: build
    file: ci/tasks/build-golang-builder-image.yml
    image: oci-build-task
    privileged: true

  - put: golang-builder-image
    params: {image: image/image.tar}


resources:
- name: ci
  type: git
  source: {uri: https://github.com/concourse/ci.git}

- name: oci-build-task
  type: registry-image
  source: {repository: vito/oci-build-task}

- name: golang-builder-image
  type: registry-image
  source: {repository: registry-docker-registry.registry.svc.cluster.local:5000/golang-builder}

- name: golang-linux
  type: s3
  source:
    endpoint: storage.googleapis.com
    bucket: golang
    regexp: 'go(\d+\.\d+(\.\d+)?)\.linux-amd64\.tar\.gz'
Naturally, looking at this, one can tell that there’s an implicit build graph that’ll be traversed by Concourse:

(the arrow indicates a “depends on”.)
But, that’s usually not enough for one to tell where things are breaking most of
the times (we’re all looking at you, flaky builds), at which rate, and whether
there are missed oportunities that we could be optimizing for (let’s say,
looking at where a given step is landing, we could uncover the fact that it
could be leveraging Concourse’s use of tags to be closer to the places doing
the gets).
Breaking that job execution down to a waterfall graph (like browsers do for requests), we could then see something in the lines of:
                                                           (5.32s)
build 123 -----------------------------------------------------

 in-parallel ------------
   get ---
   get ------------------
   get ---------
 task                     --------------------
 put                                          -------------
 get                                                       ----
ps.: yeah, that extra get is a Concourse implementation detail of resource types
pps.: yeah yeah, the visualization above is more or less a lie - a sequence of steps is more like chaining of “on success"es, but, you got the point.
Going even further (and now, this is something very valuable for operators), we could even break each step down to its internal components:
task ----------------------------------------------------------

  run                                --------------------------

    find-or-create-container         -----------------

      fetch-image-for-container      ------------

        find-or-create-container       -----

          fetch-image-for-container      -----

          create-volumes                         ---

            clone-remote-volumes                  ---


      create-volumes                    ----
        clone-remote-volumes              --
Looking at something like the visualization above, one could, for instance,
figure out that a put step is taking too long to start because Concourse is
streaming a bunch of stuff that it doesn’t need it - that could be optimized
using an explicit inputs field.
Wouldn’t that be great?
the underlying tech
Under the hood, all that we’d need is a form of keeping track of the executions as they occur (by instrumenting our code), and then transmitting that, somehow, to a system that can store those traces, letting us later gather insights from it.
        (component being observed)

        COMPONENT ..................
        .
     *--+-- web (tracks a build, thus, generates a trace w/ a bunch of spans)
     |  .
     |  .
     |
     |
     |
     |  (part of the distr tracing system)
     |
     |  COLLECTOR .................
     |  .
     *--+-> collector (stores those traces)
        .
        .
Regardless of the details of the data model, the idea is that for each trace that represents an entire build, we construct a series of spans, each having its own set of children, which then (recursively) have their own children, and so on and so forth.
   trace -----------------------   (entire build)

     span1    ------------
       span11    --------          (child of span1)

     span2                 -----   (sibling of span1)
To instrument our code, so that we can capture those traces, which we can then forward to a collector, in order to have it visualized (…) I went with opentelemetry.
The reasoning behind it is essentially that it’s been a PITA to have to deal with the specifics of different metric collection systems, so, if there’s something that is about to become a standard that we can just rely on (and not be vendor-specific), better go that way.
Aaaand, it turns out that in the case of observability in general, that seems too be now hapenning around OpenTelemetry.
As the project is still in its infancy (although it has the mileage from the other two projects that are merging into it), there are not many systems yet supported, so I picked the only once that made sense right away (which I had actually already used before, with opentracing): jaeger.
        WEB ..................
        .
     *--+-- atc/tracing/tracer.go (defines a tracer which can be
     |  .    |                     configured w/ the Jaeger exporter)
     |  .    |                          |
     |  .    |                          *-> OpenTelemetry under the hood
     |  .    |
     |  .    *-> used by things like our build tracker, and each step
     |  .        implementation
     |  .
     |
     |
     |
     |  JAEGER .................
     |  .
     *--+-> collector (stores those traces)
        .
        .
sdk
As this whole thing would only be as good as our instrumentation, it was key that I get down to a very trivial internal interface that we all in the Concourse team could use.
    // atc/tracing/tracer.go
    //

    func StartSpan(
            ctx context.Context,
            component string,
            attrs Attrs,
    ) (
            context.Context,
            trace.Span,
    )
StartSpan creates a span, giving back a context that has itself added as the
parent span.
This way, calls to such function with a context that has been generated from a previous call to this method will make the resulting span a child of the span that preceeded it.
For instance:
    func fn () {
        rootCtx, rootSpan := StartSpan(context.Background(), "foo", nil)
        defer rootSpan.End()

        _, childSpan := StartSpan(rootCtx, "bar", nil)
        defer childSpan.End()
    }
calling fn() will lead to the following trace:
    foo   0--------3
      bar    1----2
where 0 is the start of the root span, which then gets a child bar
initializing at 1, having its end called 2, and then the last span
finalization happening for the root span 3 given how defer statements
stack.
Given that contexts are supposed to propagate all the way, it becomes veeery easy to get things down to where you really care about.
For instance, consider the case of us wanting to better understand how long resource executables takes to run. Being a resource, we know that at some point, a well known executable is going to be executed, and all of that logic is already in a single place. So, all we have to do is put a tracepoint there:
    // atc/resource/run_script.go
    //

    func (resource *resource) runScript(
            ctx context.Context,
            path string,
            ...
    ) error {

            ctx, span := tracing.StartSpan(ctx, "run-script", tracing.Attrs{
                    "path": path,
            })
            defer span.End()

            // ...

    }
While that’s interesting for sure, a metric could already kinda get us there. It
really gets interesting when we connect the dots though - when we follow the
path that gets down to runScript and keep track of the execution times along
the way.
For instance, for a get, here’s how the stack trace looks like:
    0 resource.(*resource).runScript
    1 resource.(*resource).Get
    2 fetcher.(*resourceInstanceFetchSource).Create
    3 fetcher.(*fetcher).fetchWithLock
    4 fetcher.(*fetcher).Fetch
    5 exec.(*GetStep).Run
    6 exec.LogErrorStep.Run
    7 exec.(*LogErrorStep).Run
    8 exec.InParallelStep.Run.func1
If we now add a tracepoint to GetStep.Run, that essentially means that we can
break down the time taken for the whole get to occur, by the time that it’s
spent juuuuust running that script in a container that has been created:
    // atc/exec/check_step.go
    //

    func (step *GetStep) Run(ctx context.Context, state RunState) error {

            ctx, span := tracing.StartSpan(ctx, "get", map[string]string{
                    "name":          step.plan.Name,
                    "resource-type": step.plan.Type,
                    "resource":      step.plan.Resource,
            })
            defer span.End()

            // ...
    }
That’d render into something like:
    get       -----------------------------
      script             -----------------
Now, with that, a question might come to mind: what’s going on during that time right before the script? It seems signifant.
As we know that part of the time taken to run a get is spent on
creating a container in a worker - a worker needs to be chosen, then we
potentially need to fetch the base image, then create a container, etc etc. What
if we put a tracepoint there too?
The point is - once you start bringing those timings up, questions can start popping, and you can go answer those questions adding instrumentation where you see fit.

Pretty cool, right?
why now?
Almost 10 months ago I have tried something similar in the Concourse code base, but it turns out that we didn’t make much use of context propagation internally, so there was no easy way of transparently passing the spans along the way.
When it comes to getting down to the places when things are very likely to fail
(e.g., when we cross the boundary of web and get to touch workers), we’ve
been leveraging context all around, and that’s just veeery helpful.
I’m still not sure how we should go about capturing errors in the spans though
as somewhat close to 99.9% of our code doesn’t used named return parameters, so
it’s really non-trivial to have a small defer that can just add error to the
span if the whole method fails.
what’s next
I’m not entirely sure, but at least I plan to get a draft PR for this ready for discussion very soon.
From what I’ve heard, spring is the biggest product at Pivotal that has been on the route of getting distributed tracing incorporated into it, so it might be worth having some chat with the folks over there to know what their experiences are.
I’m also very curious about how aggregation looks like - it seems like most of the componanies have this piece not freely available.
Update: I started a PR (concourse/concourse#4607), which I plan to update soon with some of the shortcomings, and things to explore before moving forward.