Hey,
Recently, we (concourse) were having trouble coming up with an easy way to
answer the question of whether runc was taking too long to perform a
particular action.
Given that each action took form of executing the runc binary, it seemed to
make sense to time those executions somehow.
For instance, it’d be great to get information like
TIME(s)      ARGV
0.111638     /var/gdn/assets/linux/bin/runc --root /run/runc --debug --...
50.039328    /var/gdn/assets/linux/bin/runc --root /run/runc events d7d...
0.209312     /var/gdn/assets/linux/bin/runc --root /run/runc --debug --...
0.206789     /var/gdn/assets/linux/bin/runc --root /run/runc --debug --...
0.195814     /var/gdn/assets/linux/bin/runc --root /run/runc --debug --...
265.008811   /var/gdn/assets/linux/bin/runc --root /run/runc events 984...
75.007661    /var/gdn/assets/linux/bin/runc --root /run/runc events 6df...
95.007827    /var/gdn/assets/linux/bin/runc --root /run/runc events e26...
185.009876   /var/gdn/assets/linux/bin/runc --root /run/runc events d2a...
150.009166   /var/gdn/assets/linux/bin/runc --root /run/runc events 6ad...
While we could do that by patching the code that performs those process
executions (gdn), that’d mean having to create a separate version of it,
deploying across the fleet, and then collecting the data aftwards.
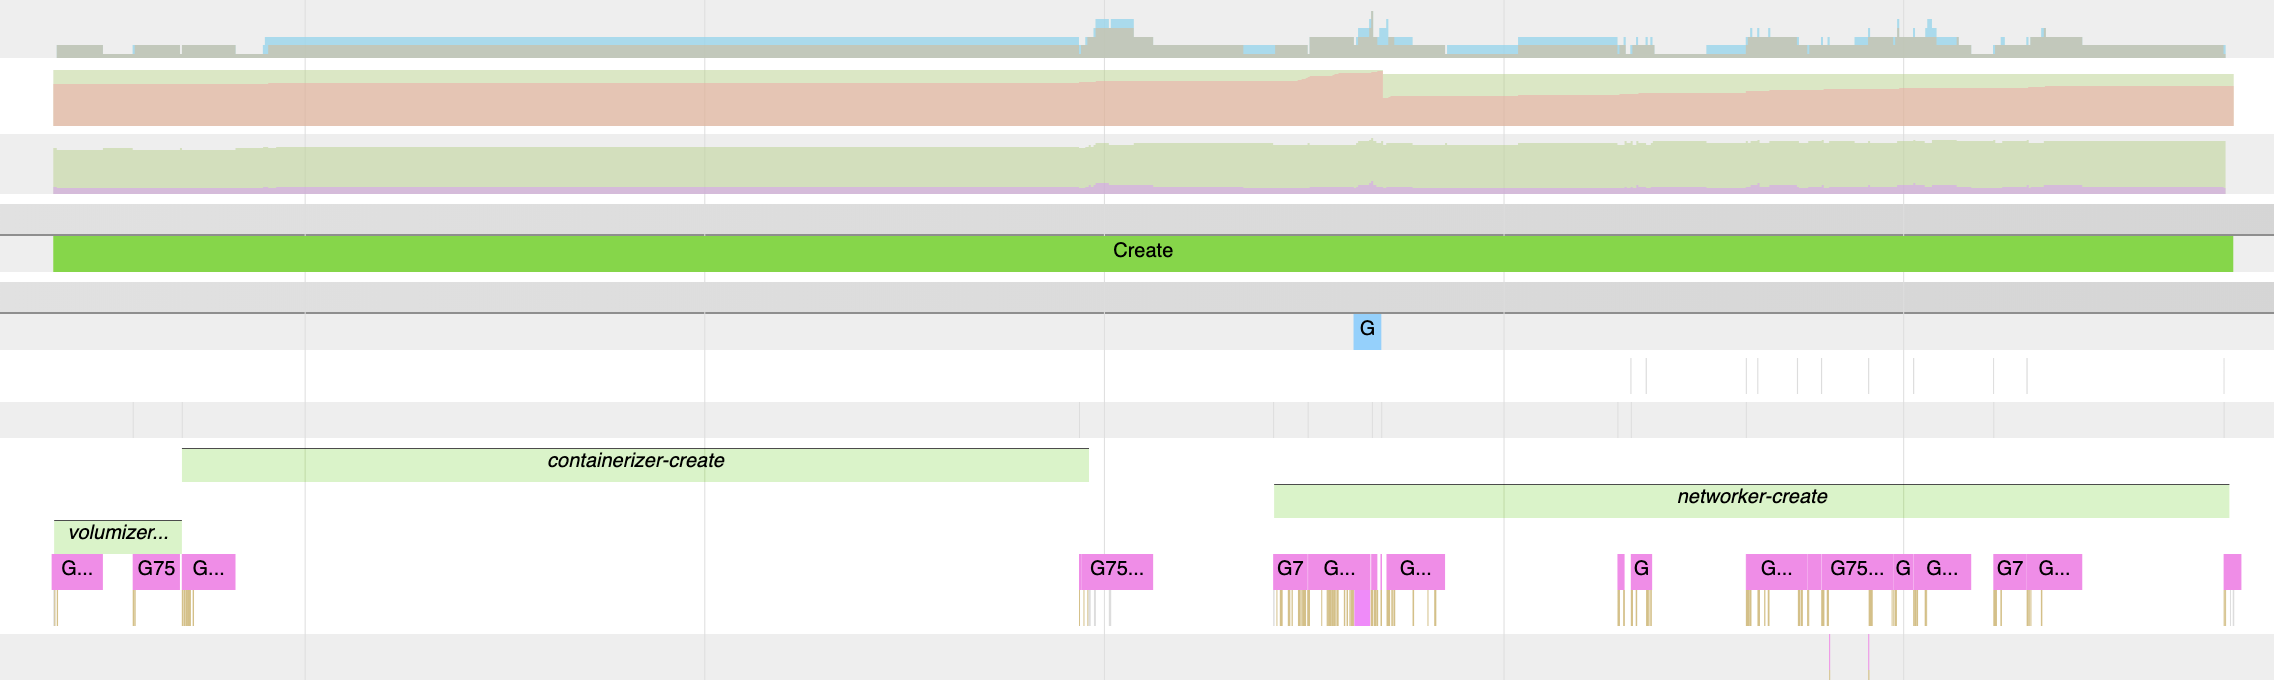
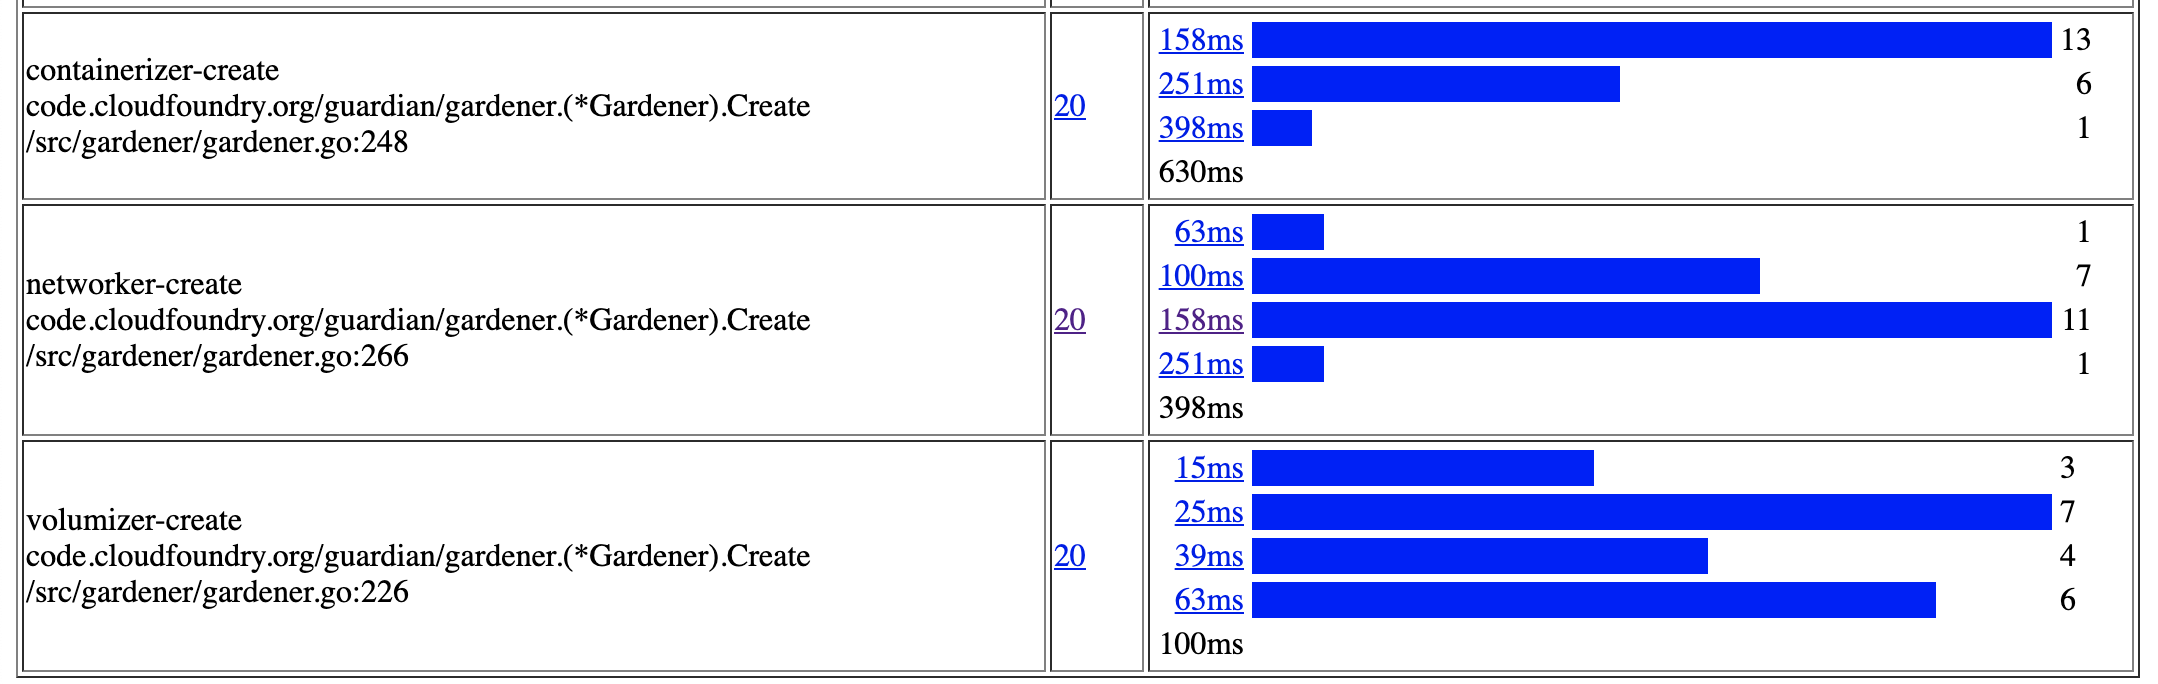
Definitely doable as we have done something similar when trying to understand
where gdn spent most of its time during container creation (see container
creation time dissected for more):
But, it turns out that there’s a way of doing that without having to rebuild and
redeploy concourse.
observing process creation time
Knowing that with ebpf we can hook into ftrace’s instrumentation and capture
details about code that’s being executed in the kernel (by being there with our
very small specifically crafted piece of code), we let a userspace program know
the details of a program that’s being started (via execve(2), and then when
it ends (via _exit(2), either voluntarily or not), know the exit status and
how long it took.
For instance, consider the following “hello world” program:
|
|
If we trace syscalls that leads to the execution of our binary, we can see that
at the start, execve(2) takes the responsability of bringing to the kernel
the information that tells what file is supposed to be loaded, with which
arguments and environmnt variables.
At the end of its execution
$ strace -f ./hello

execve("./hello", ["./hello"], 0x7ffc2316f938 /* 19 vars */) = 0
brk(NULL)                               = 0x220a000
brk(0x220b1c0)                          = 0x220b1c0
arch_prctl(ARCH_SET_FS, 0x220a880)      = 0
uname({sysname="Linux", nodename="disco", ...}) = 0
readlink("/proc/self/exe", "/home/ubuntu/hello/hello", 4096) = 24
brk(0x222c1c0)                          = 0x222c1c0
brk(0x222d000)                          = 0x222d000
fstat(1, {st_mode=S_IFCHR|0600, st_rdev=makedev(136, 2), ...}) = 0
write(1, "hello\n", 6hello
)                  = 6
exit_group(0)                           = ?
+++ exited with 0 +++
Naturally, there’s no exit_group(2) in our code - that’s because the
implementation of the C standard (glibc in my case here) is doing that for us
(see the end of the article to see where that happens in glibc).
Regardless, what matters is that if we can time how long it took between the
execve call, and the exit_group for a given pid, we’re able to measure how
long a given program took to run1.
    execve(...)        ts=100-.
                              |
                              | time=400
                              |
    exit()             ts=500-*
It turns out that with bcc, we can do that with a small mix of C and Python.
1: yeah, there are edge cases, e.g., creating a process from the
previous binary and not execveing, etc.
tracing executions with bcc
The idea of tracing executions is not new - in the set of tools that
bcc has by default, execsnoop does pretty much that: for every execve,
it reports who did that (and some other info).
In our case, we wanted to go a little bit further: wait until an exit happens,
and then time that.
The approach looked like the following:
    instrument execve
            when triggered:
                    submit data to userspace, telling who did it, etc

    instrument exit
            when triggered:
                    submit data to userspace, bringing exit code, etc
That means that while we capture the data (e.g., pid, ppid, exit code,
etc) from within the Kernel, we let our code in userspace deal with the logic of
deciding what to do with that information:
- should I care about this
execve? - is this an
exitfrom a process that I was already tracing?
As the events come from the kernel first, let’s see how that instrumentation looks like.
in the kernel
Leveraging kretprobes, when instrumenting these functions we’re able to capture
not only all of those arguments used to call it, but also value returned by that
specific call.
    my_cool_func+start      <--kprobe
                                    => our_method(args ...)
            |
           ...
            |
    my_cool_func+end        <--kretprobe
                                    => our_method(retval + args ...)
For instance, we can ignore those execves that failed, while still moving on
otherwise.
    // instrument the `execve` syscall (when it returns)
    //

    int
    kr__sys_execve(struct pt_regs* ctx,
                   const char __user* filename,
                   const char __user* const __user* __argv,
                   const char __user* const __user* __envp)
    {
            int ret = PT_REGS_RC(ctx);
            if (ret != 0) {         // did the execve fail?
                    return 0;
            }

            __submit_start(ctx);

            return 0;
    }
For _exit, using a kprobe suffice as all that we need is the code being
passed to it.
    // instrument `_exit` syscall
    //

    int
    k__do_exit(struct pt_regs* ctx, long code)
    {
            __submit_finish(ctx, code);
            return 0;
    }
Then, during __submit_finish and __submit_start, we can then do the whole
job of filling the datastructure to be sent to userspace with the right fields,
and then actually doing so (submitting to the perf buffer).
For instance, __submit_start:
    static inline void
    __submit_start(struct pt_regs* ctx)
    {
            struct data_t data = {};

            data.type = EVENT_START;

            __submit(ctx, &data);
    }


    static inline void
    __submit_finish(struct pt_regs* ctx, int code)
    {
            struct data_t data = {};

            data.type = EVENT_FINISH;
            data.exitcode = code;

            __submit(ctx, &data);
    }
And then, finally, on __submit, adding the final common fields (like,
timestamp when this was called), and then submitting to the perf buffer:
    static inline void
    __submit(struct pt_regs* ctx, struct data_t* data)
    {
            struct task_struct* task;

            task = (struct task_struct*)bpf_get_current_task();

            data->ts = bpf_ktime_get_ns();
            data->pid = task->tgid;
            data->ppid = task->real_parent->tgid;
            bpf_get_current_comm(&data->comm, sizeof(data->comm));

            events.perf_submit(ctx, data, sizeof(*data));
    }
in userspace
Once everything has been instrumented, we can receive the events from the kernel by waiting for them:
    program["events"].open_perf_buffer(handle_events)

    while 1:
        try:
            program.perf_buffer_poll()
        except KeyboardInterrupt:
            exit()
Which then, on handle_events, can handle each event being submitted:
|
|
With that all set up (see trace.py), we can then get that information:
    sudo ./trace.py
    PID              PPID             CODE             TIME(s)          ARGV
    8168             2921             0                0.002005         ls --color=auto
    8169             2921             0                1.001772         sleep 1
tracing process execution in a cgroup
As tracing the whole system can generate quite a bit of noise, and most of what we wanted to keep track of was contained in a non-root cgroup, it made sense to allow tracing process executed within a given cgroup.
Each task in the system has a reference-counted pointer to a css_set.
(extra) where is glibc calling exit_group?
If you’re wondering how one goes from a return 1 in int main(argc,argv) to
an exit_group() using that 1 returned, here’s a very quick walk through
glibc.
    STATIC int
    LIBC_START_MAIN(int (*main)(int, char**, char** MAIN_AUXVEC_DECL),
                    int argc,
                    char** argv,
                    __typeof(main) init,
                    void (*fini)(void),
                    void (*rtld_fini)(void),
                    void* stack_end)
    {
            /* Result of the 'main' function.  */
            int result;

            /* Nothing fancy, just call the function.  */
            result = main(argc, argv, __environ MAIN_AUXVEC_PARAM);

            exit(result);
    }
https://elixir.bootlin.com/glibc/glibc-2.30/source/csu/libc-start.c#L339
    void
    exit (int status)
    {
              __run_exit_handlers (status, &__exit_funcs, true, true);
    }
https://elixir.bootlin.com/glibc/glibc-2.30/source/stdlib/exit.c#L137
    /* Call all functions registered with `atexit' and `on_exit',
       in the reverse of the order in which they were registered
       perform stdio cleanup, and terminate program execution with STATUS.  */
    void attribute_hidden
    __run_exit_handlers(int status,
                        struct exit_function_list** listp,
                        bool run_list_atexit,
                        bool run_dtors)
    {
            // ... run each handler, then, finally

            _exit(status);
    }
https://elixir.bootlin.com/glibc/glibc-2.30/source/stdlib/exit.c#L132
    void
    _exit(int status)
    {
            while (1) {
    #ifdef __NR_exit_group
                    INLINE_SYSCALL(exit_group, 1, status);
    #endif
                    INLINE_SYSCALL(exit, 1, status);

    #ifdef ABORT_INSTRUCTION
                    ABORT_INSTRUCTION;
    #endif
            }
    }
https://elixir.bootlin.com/glibc/glibc-2.30/source/sysdeps/unix/sysv/linux/_exit.c#L26