Hey,
Oftentimes I see myself needing to check response times while making a bunch of requests quickly. Most of the tools out there either do not continuously make new requests (via an entirely new TCP connection) or don’t expose connection times.
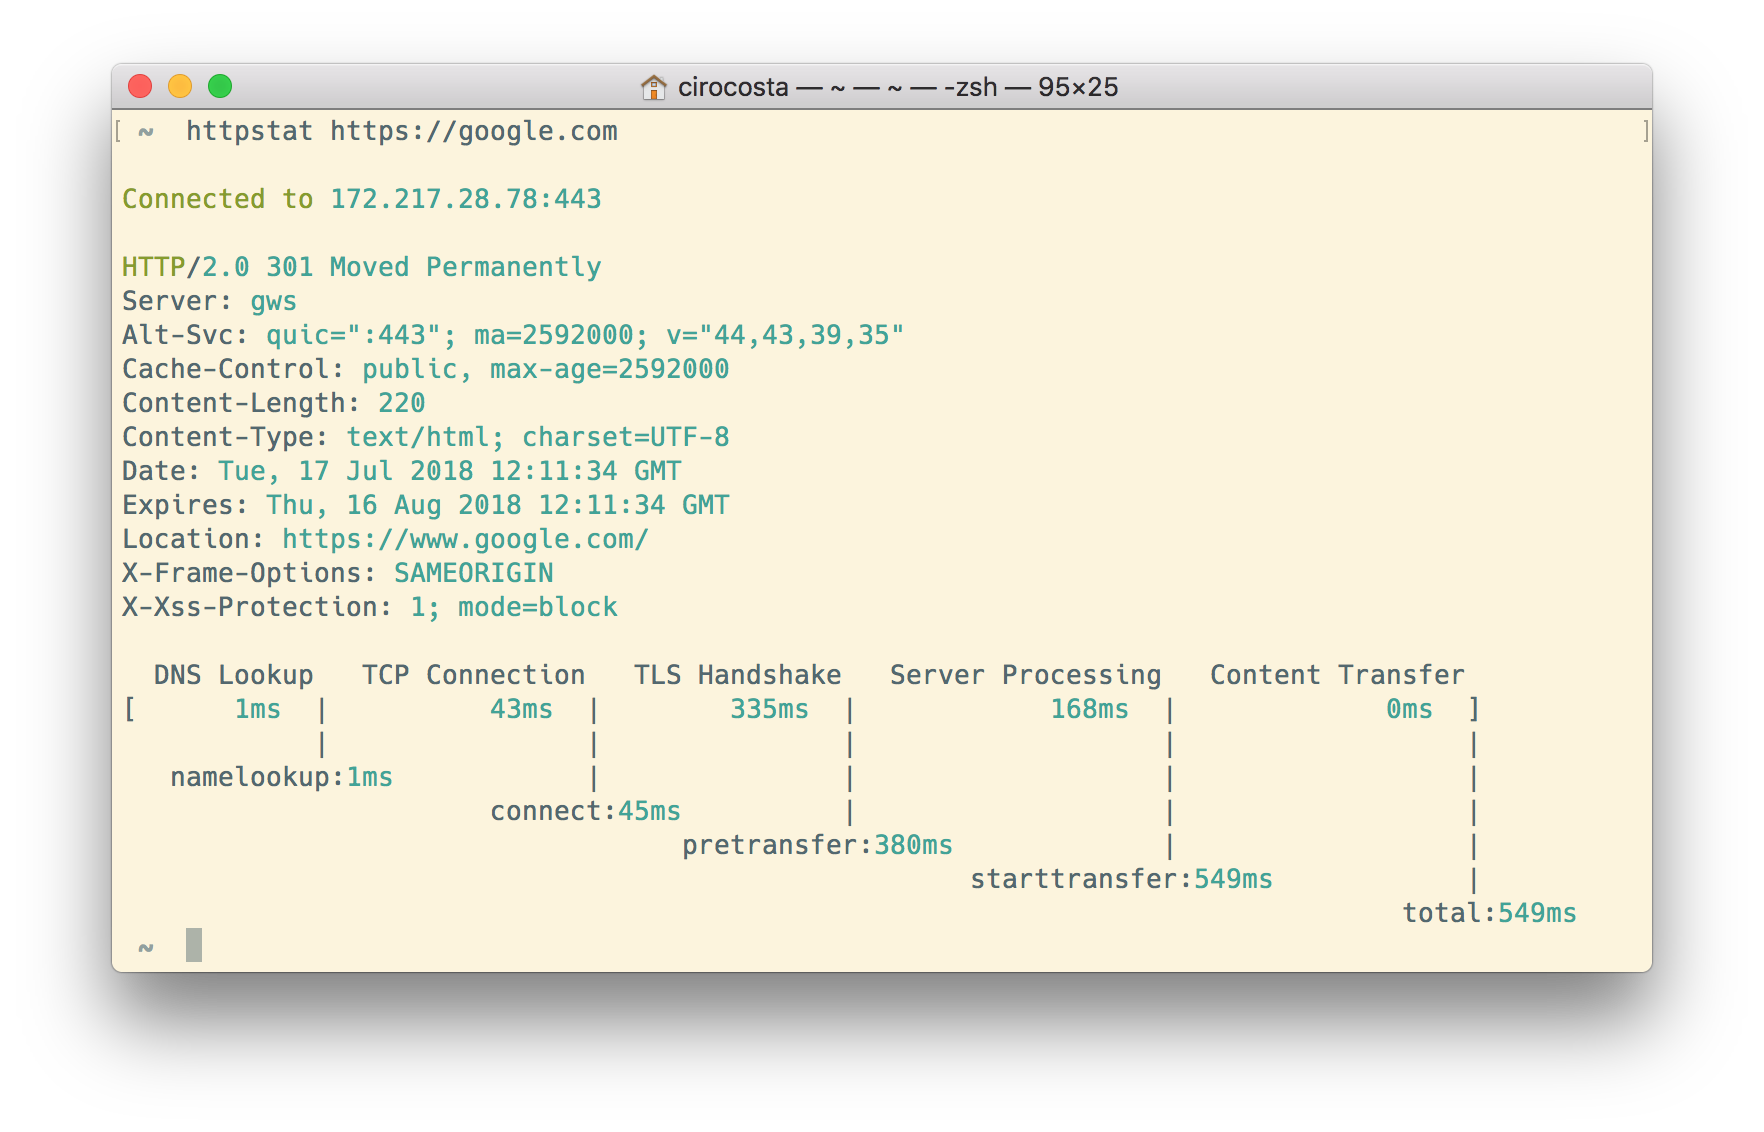
httpstat is a great tool that does the job really well. It’s a single binary that you can put under your $PATH and have nice stats, but it’s yet another tool, and you might just be inside a container (or maybe a sealed environment?) and want to check response times quickly.
curl comes very handy when needing to have an easy way of displaying response times. Tied with a little of shell scripting, you can even create a comma-separated values output that allows you to see how it changes over time.
Discovering the right curl flags
Looking at man curl (curl’s man page), we can see that there’s an interesting flag named --write-out that we can leverage to gather further insights about the connection:
-w, --write-out <format>
        Make curl display information on stdout
        after a completed transfer.

        The format is a string that may contain plain
        text mixed with any  number  of  variables.

        The variables present in the output format will
        be substituted by the value or text that curl
        thinks fit, as described below.

        All variables are specified  as %{variable_name}.
What are these variables? Let’s see some of them:
http_code           The  numerical  response  code that was found
                    in the last retrieved HTTP(S) or FTP(s) transfer.

time_appconnect     The time, in seconds, it took from the start until
                    the SSL/SSH/etc connect/handshake to the remote host
                    was completed.

time_connect        The time, in seconds, it took from the start until
                    the TCP connect to the remote host (or proxy) was
                    completed.

time_namelookup     The time, in seconds, it took from the start until the name
                    resolving was completed.

time_pretransfer    The time, in seconds, it took from the start until the
                    file transfer was just about to begin.

time_starttransfer  The time, in seconds, it took from the start until the first
                    byte was just about to be transferred.

time_total          The total time, in seconds, that the full operation lasted.
Knowing those variables, it becomes a matter of creating a format (a template) to pass to the --write-out flag specifying which variables we want to see.
# Check out how much time it's going to take for the
# name resolution to happen.
curl --write-out '%{time_namelookup}' https://google.com
<HTML><HEAD><meta http-equiv="content-type" content="text/html;charset=utf-8">
<TITLE>301 Moved</TITLE></HEAD><BODY>
<H1>301 Moved</H1>
The document has moved
<A HREF="https://www.google.com/">here</A>.
</BODY></HTML>
0.068856
You can see that it took 0.06 seconds, but it also contains some information there that doesn’t really matter for me - if all we want is the timing information, why get all that information from the body?
We can get rid of that by telling curl to send the body to the null device:
#  -o, --output <file> Write output to <file> instead of stdout
curl \
        --output /dev/null \
        --write-out '%{time_namelookup}' \
        https://google.com
  % Total    % Received % Xferd  Average Speed   Time    Time     Time  Current
                                 Dload  Upload   Total   Spent    Left  Speed
100   220  100   220    0     0    462      0 --:--:-- --:--:-- --:--:--   462
0.069249
Well, we still have some stuff left - there are these extra header lines that tells us curl’s progress.
Fortunately, we can get rid of that too:
# -s, --silent
# Silent  or  quiet  mode.
# Don't  show progress meter or error messages.
# Makes Curl mute.
# It will still output the data you ask for.
curl \
        --output /dev/null \
        --silent \
        --write-out '%{time_namelookup}' \
        https://google.com
0.004344
Cool, now that we have the information we want, let’s tailor a script retrieves all the information needed.
A snippet for printing a CSV of response times using CURL
Knowing how the command looks like, now it’s a matter of creating a better defined templated and let it run for n times:
#!/bin/bash

# Set the `errexit` option to make sure that
# if one command fails, all the script execution
# will also fail (see `man bash` for more
# information on the options that you can set).
set -o errexit

# This is the main routine of our bash program.
# It makes sure that we've supplied the necessary
# arguments, then it prints a CSV header and then
# keeps making requests and printing their responses.
#
# Note.: because we're calling `curl` each time in
#        the loop, a new `curl` process is created for
#        each request.
#
#        This means that a new connection will be made
#        each time.
#
#        Such property might be useful when you're testing
#        if a given load-balancer in the middle might be
#        messing up with some requests.
main () {
  local url=$1

  if [[ -z "$url" ]]; then
    echo "ERROR:
  An URL must be provided.

  Usage: check-res <url>

Aborting.
    "
    exit 1
  fi

  print_header
  for i in `seq 1 10000`; do
    make_request $url
  done
}

# This method does nothing more that just print a CSV
# header to STDOUT so we can consume that later when
# looking at the results.
print_header () {
  echo "code,time_total,time_connect,time_appconnect,time_starttransfer"
}

# Make request performs the actual request using `curl`.
# It specifies those parameters that we've defined before,
# taking a given `url` as its parameter.
make_request () {
  local url=$1

  curl \
    --write-out "%{http_code},%{time_total},%{time_connect},%{time_appconnect},%{time_starttransfer}\n" \
    --silent \
    --output /dev/null \
    "$url"
}

main "$@"
Trying it out:
./check-res https://google.com
code,time_total,time_connect,time_appconnect,time_starttransfer
301,0.469397,0.125566,0.292027,0.469221
301,0.380109,0.049464,0.204842,0.379735
301,0.389428,0.048424,0.208052,0.389043
301,0.731204,0.047314,0.547336,0.730819
301,0.379709,0.048266,0.205082,0.379577
301,0.384067,0.048614,0.211338,0.383765
Closing thoughts
While there are tools out there that are able to do this, it’s very useful to have some options to quickly test out when you’re in the middle of an on-call.
I hope this article was useful for you! If you have any questions or just want to chat a bit, I’m @cirowrc on Twitter.
I’m planning to post some other articles regarding useful shell scripts that I use, so make sure you also subscribe to the mailing list to get updates on that topic.
Have a good one!
Ciro