Hey,
some weeks ago I wrote a Docker logging plugin that acts as an oklog forwarder: oklog-docker-plugin.
oklog makes use of a fairly straightforward format for ingesting logs: send it a line with some predefined fields and ta-da, it’ll be properly ingested.
While coding the plugin, I remember considering whether I should buffer these stuff or not.
My rationale was that I should probably look at the tradeoff of between immediate availability of the logs and some kind of network optimization by reducing the number of writes that I’d perform, thus reduce the number of packets inflight in a given time.
That got me to wonder how much of perceived differences we could find via buffering writes and how does that change as we switch from a given size to another.
What I expected: in the beginning, the more we cache, the better; we’ll achieve some peak, and then after that, we’ll start getting worse than not buffering or buffering at a given limit given that the whole write will be broken in parts. Does this hold true for real scenarios? How does it perform?
Testing it
To test that, I managed to have the following:
- set a given reasonable amount of data to transfer
- prepare a test executable that would transfer this with the different buffer sizes by passing a different parameter
- run each test execution multiple times; average the results for each.
The easiest way I could find to have buffering set was to make use of setvbuf(3):
SETBUF(3)                 Linux Programmer's Manual                SETBUF(3)

NAME
       setbuf, setbuffer, setlinebuf, setvbuf - stream buffering operations

       ...

       int setvbuf(FILE *stream, char *buf, int mode, size_t size);

       The setvbuf() function may be used on any open stream to  change  its
       buffer.
The coolness of this method is that we can either provide a buffer of our own (and then, say, inspect it at any time we want) or let glibc take care of that. We can skill all the buffering if desired by setting a flag or make it perform buffering based on newlines. Something to take notice is that setvbuf is applied to a FILE, which is not our primary target when making use of sockets.
This means that to benefit from those methods we have to associate a socket with a FILE first and just after that set the buffering mode for methods that make use of that stream.
Establishing connections and associating sockets with FILE streams
To associate a socket with a file stream we have to, right after getting a socket, make use of fdopen(3):
The fopen() function opens the file whose name is the string pointed to by path and associates a stream with it.
Given that when we establish a TCP connection, we have both ways (read and write), we can associate the socket with to separate file streams.
To make that easy to deal with I started by creating a struct (see when-to-buf/conn.h) that would hold these two streams and then deal with establishing the connections.
typedef struct conn {
	FILE* rx;
	FILE* tx;
	int fd;
} t_conn;
The struct gets initialized differently depending on whether we’re dealing with a client (active) or server (passive) connection.
For instance, on the server side we accept(2) on the listen_fd and then prepare the t_conn struct:
int
init_server_conn(t_conn* connection, int listen_fd)
{
	int conn_fd;
	struct sockaddr_in client_addr;
	socklen_t client_len = sizeof(client_addr);

        // `accept` extracts the first conn request from the queue of
        // pending connections for the listening socket `listen_fd`
        // and then created a new connected socket.
	conn_fd =
	  accept(listen_fd, (struct sockaddr*)&client_addr, &client_len);
	if (conn_fd == -1) {
		perror("failed to accept connection - accept");
		return 1;
	}

	connection->fd = conn_fd;

        // with `fdopen` we create a FILE stream for the `read`
        // side of the socket
	connection->rx = fdopen(conn_fd, "r");
	if (connection->rx == NULL) {
		perror("failed to associate socket with rx stream - fdopen");
		return 1;
	}

        // to create the second FILE stream we first duplicate the
        // socket file descriptor and then open it with write only
        // capabilities
	connection->tx = fdopen(dup(conn_fd), "w");
	if (connection->tx == NULL) {
		perror("failed to associate socket with tx stream - fdopen");
		return 1;
	}

	return 0;
}
Once we have t_conn set up, writing to it became as simple as writing to a file. Any method that takes a FILE (like fprintf or fwrite…) could now be an entry point to writing to that connection.
Writing to the connection
To perform the buffered writes, setvbuf end up looking like the following (see when-to-buf/client.c#work_on_connection):
int
work_on_connection(t_conn* connection, int bufsize)
{
        int to_write = bufsize;
	char* write_buf;
	// ...

        // if we want to buffer our writes, then prepare a
        // buffer that will hold the data prior to pushing it
        // to the real underlying connection via `write(2)`s
	if (bufsize > 0) {
		write_buf = malloc(bufsize * sizeof(char));
		if (write_buf == NULL) {
			perror("failed to allocate write_buf");
			return 1;
		}

                // make `glibc` make use of our buffer and always buff
                // up to `bufsize`.
		err = setvbuf(connection->tx, write_buf, _IOFBF, bufsize);
		if (err != 0) {
			perror("failed to set block buffer - setvbuf");
			return 1;
		}
	        // ...
        }

	for (;;) {
                // ...
                // send data to `fwrite` such that it can perform
                // the buffering as performed above and then
                // end up writing to the connection at some point
		n = fwrite(SOURCE_BUFFER + total_written,
		           sizeof(char),
		           to_write,
		           connection->tx);
                // ...
	}
        // ...
}
With that set, it was now time to make sure that our underlying write(2) calls were being buffered as we intended.
To test that, the easiest way was to set SOURCE_BUFFER to something small, like 1024 bytes
- #define SRC_BUFSIZE (1 << 25)
+ #define SRC_BUFSIZE (1 << 10)
  diff client.c
and then verify for different bufsizes how many write(2) calls are made.
First we start with a big buffer (bufsize=1024):
# Run `strace` watching the execution of the
# `./client` executable taking the arguments
# `127.0.0.1` (address) and `1024` (bufsize).
#
#  ps.: -w : summarise time different between executions
#       -c : count the executions

# In this case, we expect to have a *very*  low number
# of `write(2)`s as we should be able to fill the whole
# thing in a single `write(2)` call, with no buffering
# at all.

strace -c -f -w ./client 127.0.0.1 1024

% time     seconds  usecs/call     calls    errors syscall
------ ----------- ----------- --------- --------- ----------------
 33.22    0.000288          72         4           close
 18.92    0.000164          82         2           write        <<<<<<<<<<
 13.03    0.000113         113         1           execve
  ...
  0.35    0.000003           3         1           arch_prctl
------ ----------- ----------- --------- --------- ----------------
100.00    0.000867                    36         3 total
                                      /\
                                      ||
                                  low amount (Y)
After that, with a very small buffer (bufsize=1):
# Now, with a `bufsize` that's as low as 1 byte, we should
# expect to have the number of `write(2)`s to be pretty big
# (close to 1024):
strace -c -f -w ./client 127.0.0.1 1


% time     seconds  usecs/call     calls    errors syscall
------ ----------- ----------- --------- --------- ----------------
 94.58    0.011862          12      1025           write        <<<<<<<<<
  2.72    0.000341          85         4           close
  ...
  0.02    0.000003           3         1           arch_prctl
------ ----------- ----------- --------- --------- ----------------
100.00    0.012542                  1059         3 total
                                    /\
                                    ||
                            a bunch of syscalls
cool, so we have what we need setup:
- control
bufsizevia CLI arguments - have buffered writes with different buffer sizes
now it’s time to make it run!
Running some scenarios
The first scenario I wanted to test was the one that I could predict the outcome pretty well.
- communication between client and server via loopback
As the loopback interface isn’t more than a virtual NIC and doesn’t even makes use of Ethernet, we should be able to transfer these packets as fast as possible regardless of the size (ps.: we’d not have everything being sent in a single packet as we still make use of IP).
That said, the improvements should be seen as we get bigger and bigger buffer sizes.
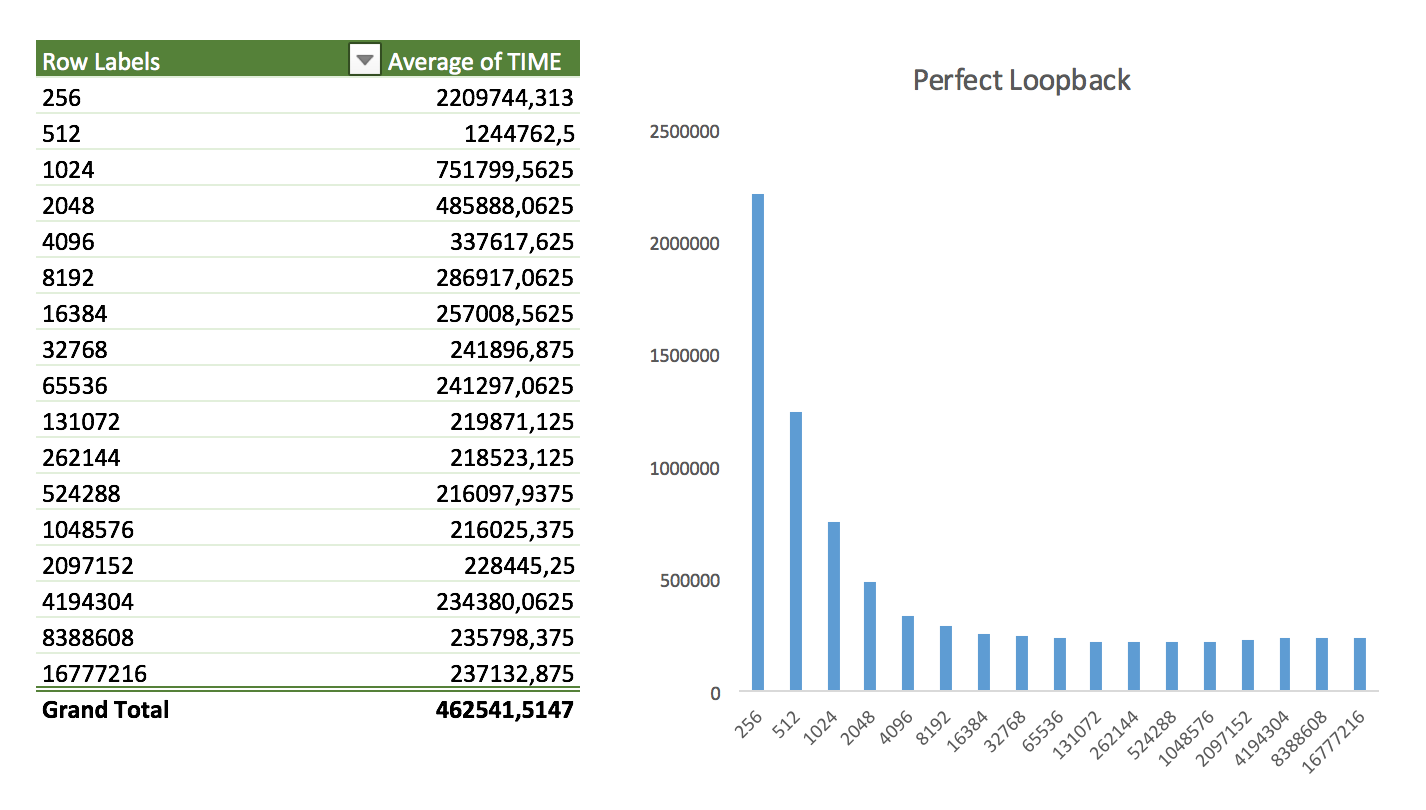
It really is - overall, increasing the size of the buffers help.
Is this too far from reality? Well, in some cases. For those deploying Kubeneretes services, it’s very common to have sidecars, i.e, collocation of containers. In this case, you’re running another container in the same shared namespaces, and you’re entirely able to communicate via loopback (e.g, for relaying logs!). It’s debatable if you should be using the whole network stack in such case (as opposed to unix sockets), but it’s a case.
Next, I wanted to check how it performs when there are some failures and delays in the communication. In theory, this is where buffers should shine after all.
Introducing problems in the network
To introduce both consistent and eventual delays, as well as the ability to drop packages at a given rate, I made use of tc(1). Change the queueing discipline of the interface, and you’ll have a messed up scenario*.
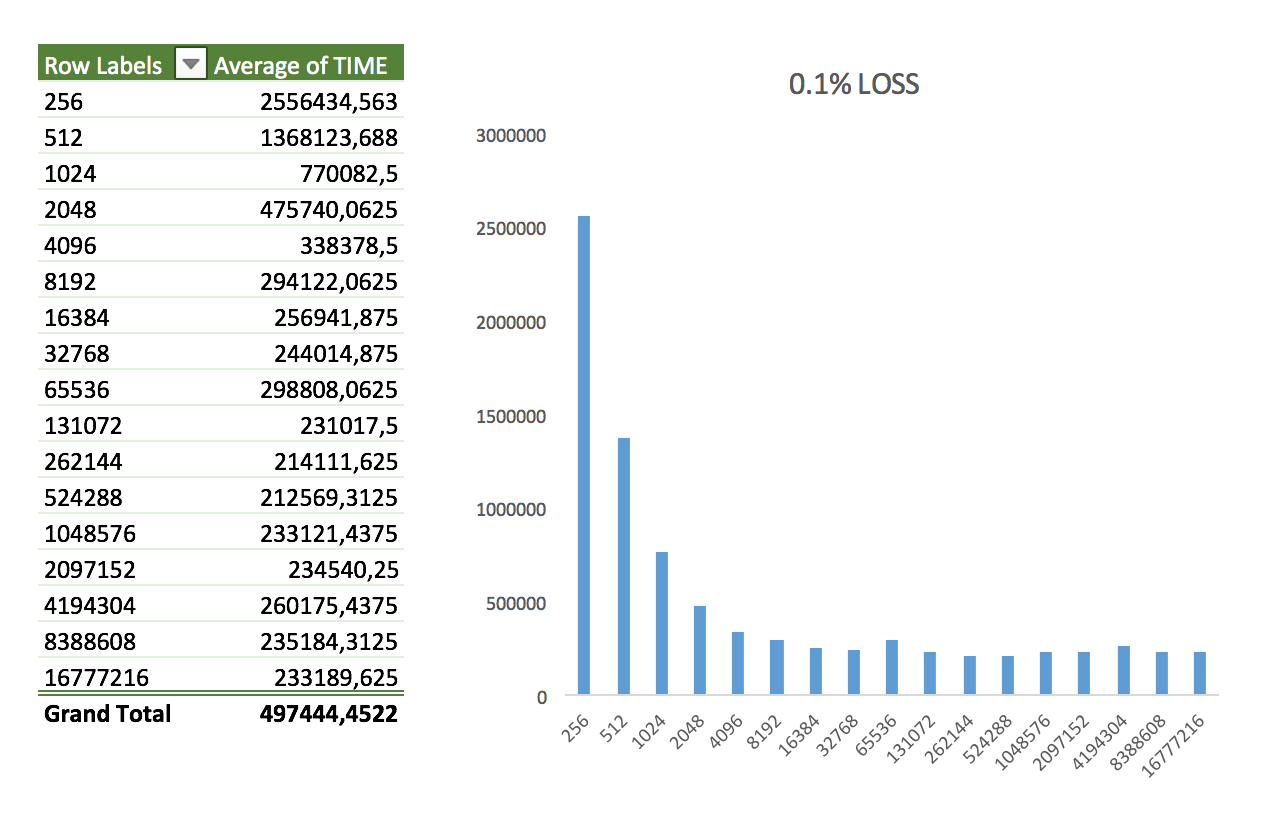
Keeping the total transfer size constant (1GB), I tried five scenarios. First I started with package loss:
- Random package loss applied to 0.1% of all packages
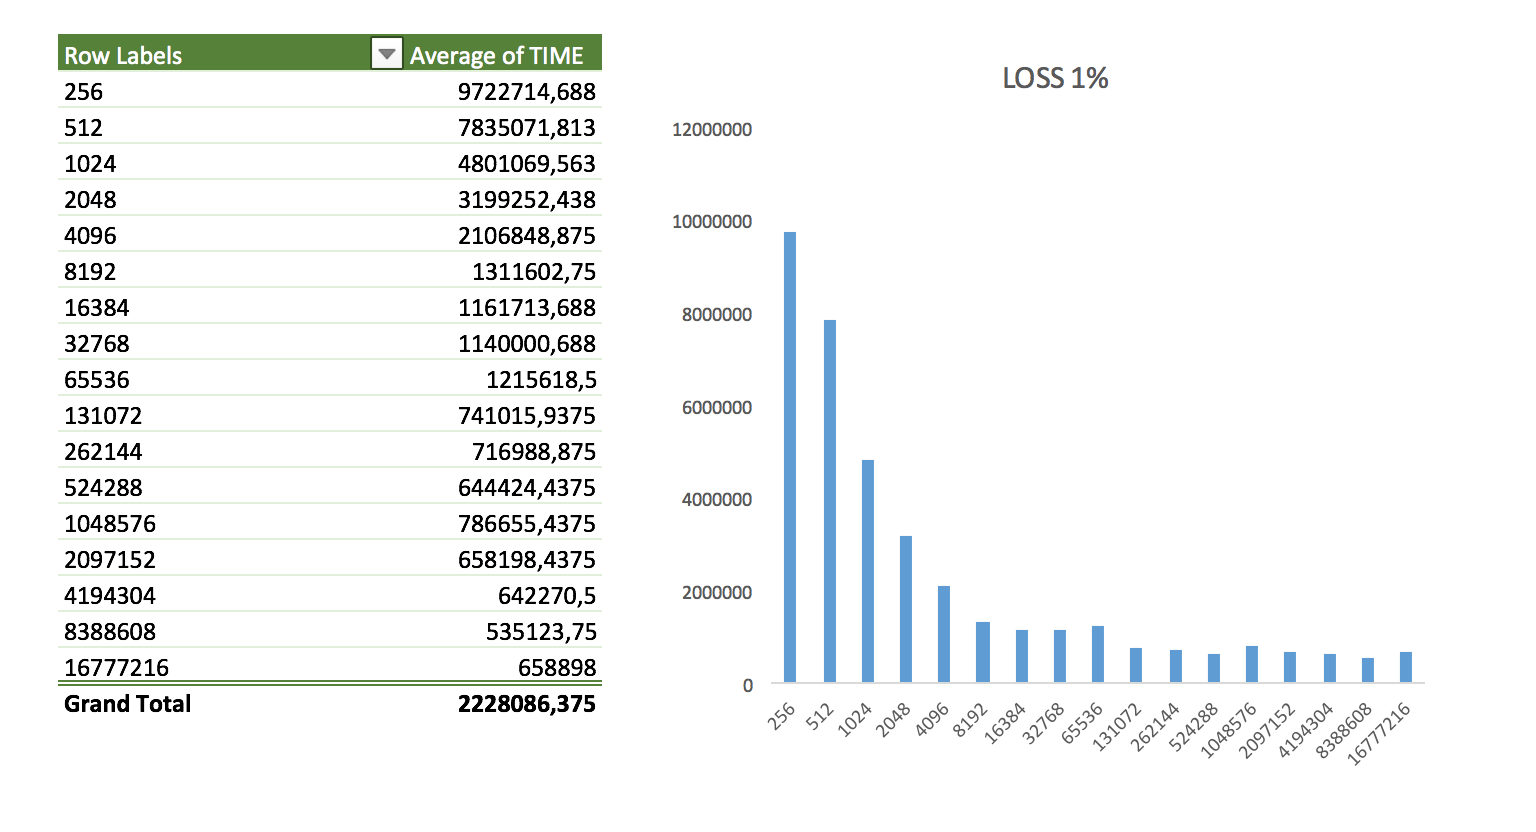
- Random package loss applied to 1% of all packages
- Random package loss applied to 5% of all packages
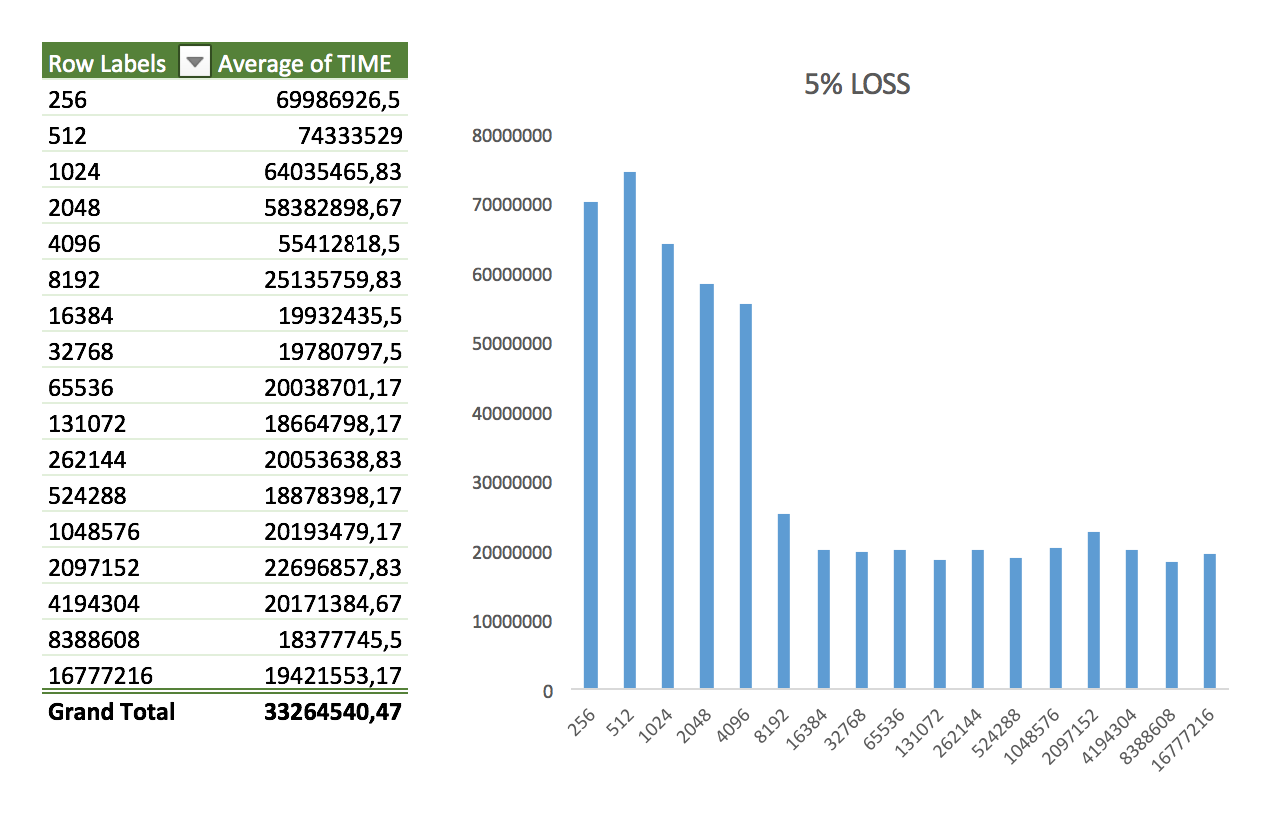
Nothing too interesting here. The shape of the data looks like the same as in the perfect loopback scenario. It might vary a little bit more but nothing impressive.
The game changes when it comes to delays though.
- Consistent delay of 5ms to all packages
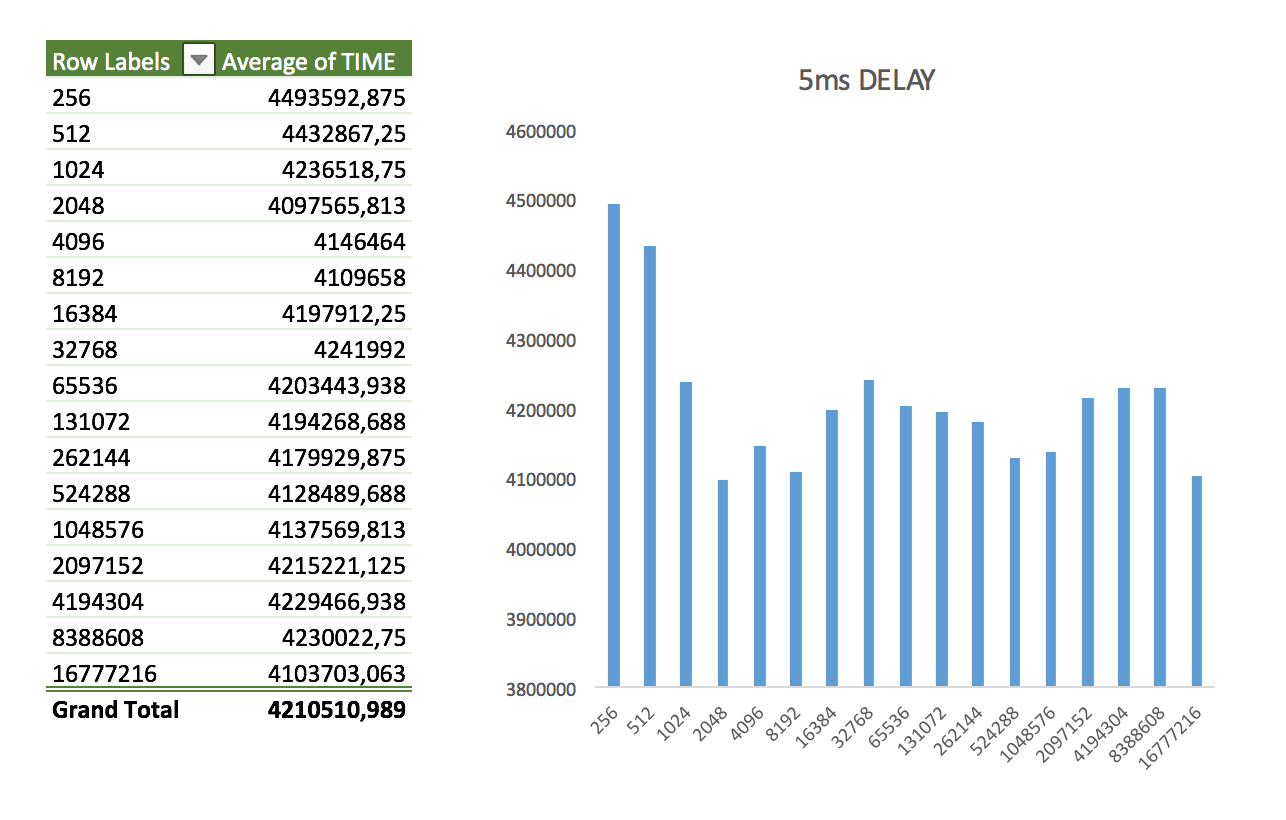
- Consistent 10ms to all packages
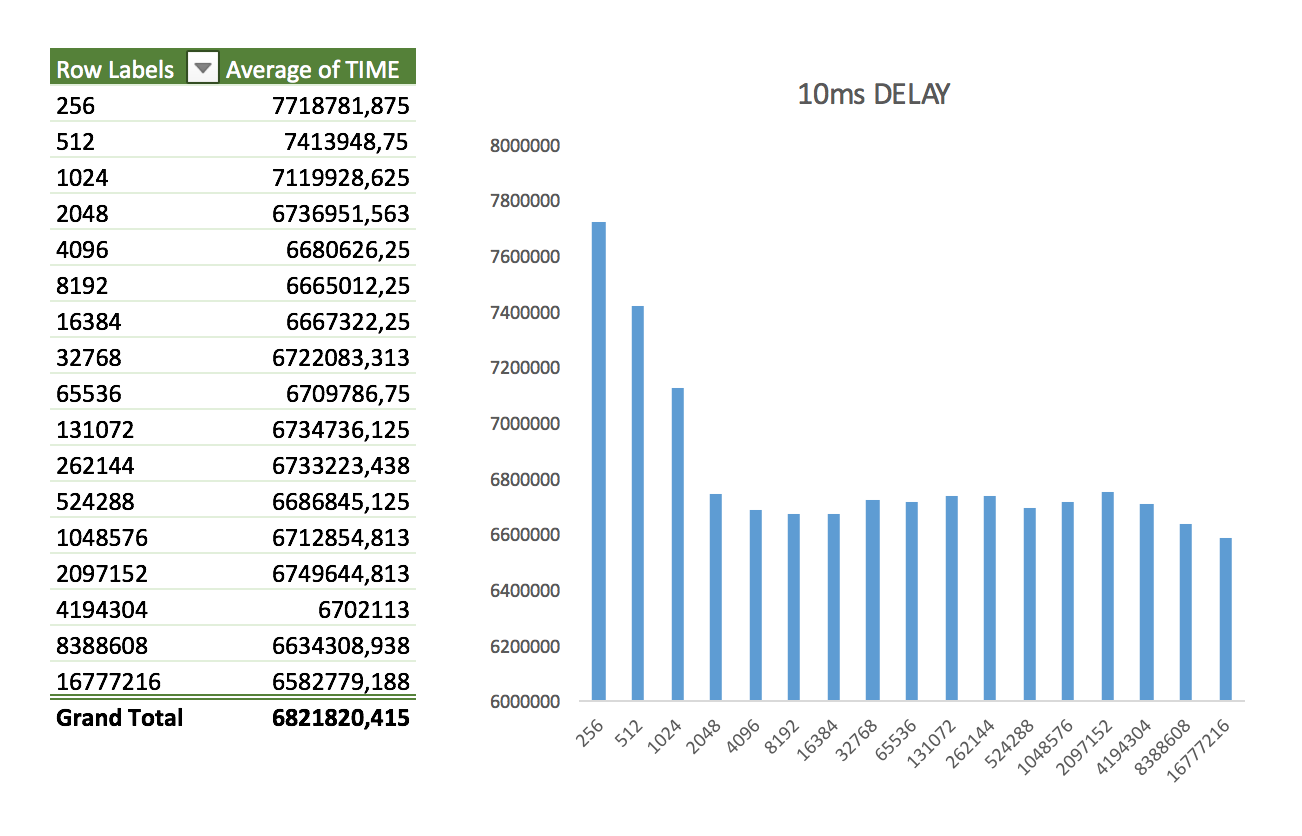
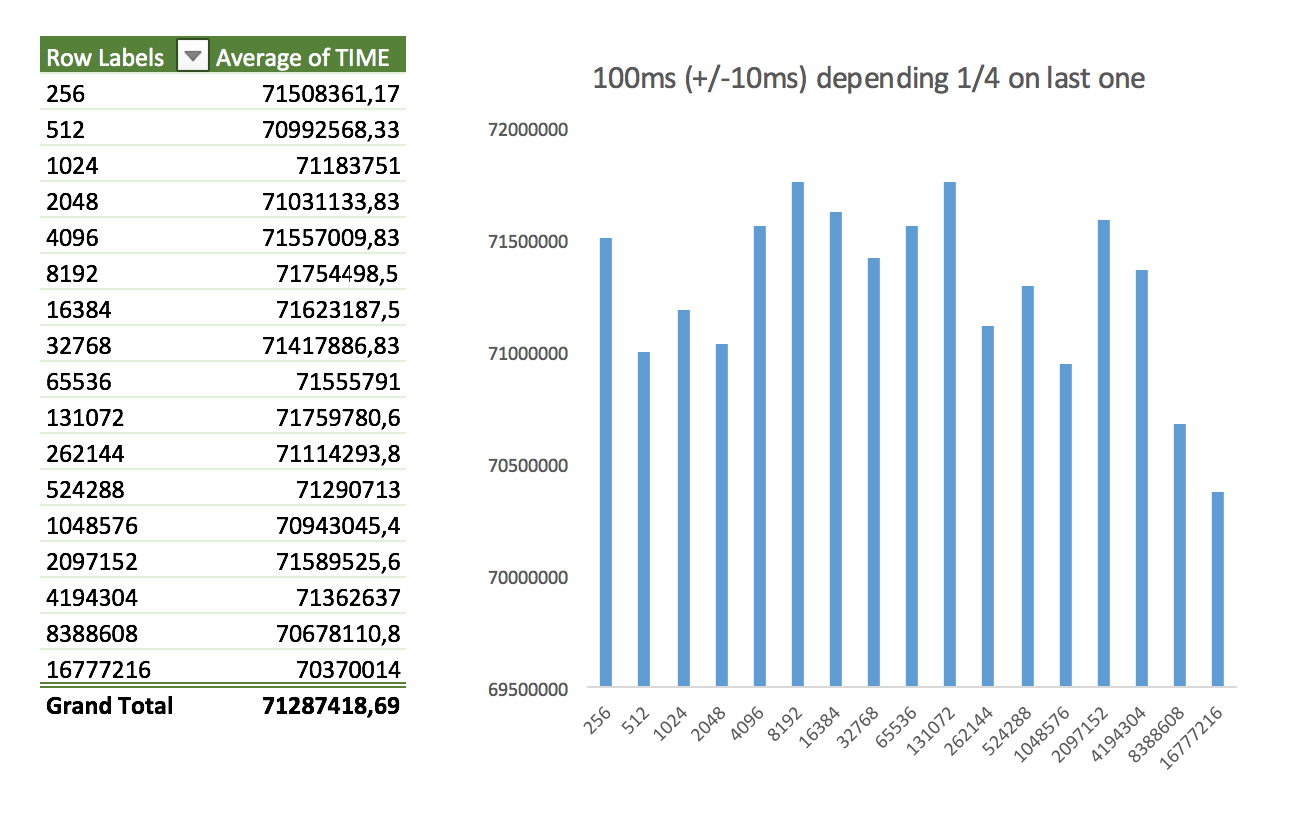
- Bursting delay - added delay of 100ms (+/- 10ms) with the next random element depending on 25% on the last one
If you’re curious about how to perform the same kind of traffic shaping in your own loopback, these were the rules used:
tc qdisc add dev lo root netem loss 0.1%
tc qdisc change dev lo root netem loss 1%
tc qdisc change dev lo root netem loss 5%
tc qdisc change dev lo root netem delay 100ms 10ms 25%
tc qdisc change dev lo root netem delay 5ms
Closing thoughts
I found pretty surprising how delays introduced a much more diverse result compared to package loss.
In the future, I might explore this a bit more, but I think this is enough and worth sharing.
If you spot any mistakes or think that I might have gotten everything wrong, please let me know! I’d appreciate a lot perfecting this and understanding better the results.
You can get the Excel worksheet that I created here: when-to-buf.xslx.
I’m cirowrc on Twitter, feel free to drop me a message there!
Have a good one,
finis