Hey,
some time ago I had the challenge of setting a monitoring system for some machines in AWS.
I end up taking Prometheus as the system to retrieve the metrics from the sources and Grafana as the way of graphing them. Nothing fancy, pretty standard.

After that, I had a problem though. How could I test this setup locally?
Everything was very much tied to how service discovery worked within an AWS environment. The machines would get fetched from EC2’s DescribeInstances with all the tags that were set up for them. With the relabelling feature, I was able to make use of those tags to improve the metrics and have a better sense of data. How could I replicate that locally?
Check out how I end up solving that.
ps.: this is one way - here are undoubtedly many others.
Tailoring the AWS Prometheus configuration
As each environment has its specificities regarding how to gather information, about where are the machines and what information can be retrieved from they, I created separate configuration files that achieve the same end goal: expose machine metrics, docker daemon metrics as well as container metrics.
prometheus
    └── config
        ├── aws.yml             # aws-specific configuration
        └── vagrant.yml         # vagrant-specific configuration
As each machine has (mostly) the same exporters, they’re all alike with just a few changes.
ps: some machines have different exporters, e.g., load-balancer machines have haproxy_exporter.
Here’s a Prometheus configuration aiming at getting information about AWS machines that enhance the metrics with custom AWS tags:
# AWS configuration

global:
  scrape_interval: '10s'
  evaluation_interval: '10s'

scrape_configs:

  # Collect metrics about the node.
  #
  # These are plain `node_exporter` metrics that
  # are scrapped to reveal all sorts of machine
  # metrics like cpu, inode utilization for each fs,
  # memory, iface statistics ...
  #
  # In this example I'm not specifying the AWS access token,
  # secret key and regions because the AWS golang client will
  # get it from the environment using the default namings,
  # leaving us only to need to specify the port to scrape.
  - job_name: 'node'
    ec2_sd_configs:
      - port: 9100
    relabel_configs:

      # Because we could have multiple environments running
      # in the same region or some ephemeral machines that
      # are not meant to be scrapped, filter out those that
      # do not contain a specific tag.
      - source_labels:
        - '__meta_ec2_tag_tips_ops_environment'
        regex: 'dev1'
        action: 'keep'

      # Gather the instance id and use it as the name of the
      # instance.
      #
      # This allows us to not use the weird hostname that aws provides
      # but instead, the instance ID that AWS we can gather from the
      # service discovery.
      - source_labels:
        - '__meta_ec2_instance_id'
        target_label: 'instance'

      # To enhance the intel and understand better what's going on,
      # here I also retrieve an extra tag that the machines are
      # supposed to have.
      #
      # In this example I set `tips_ops_node_type` to the machine
      # tag (e.g., m4.4xlarge) but this could be anything.
      #
      # Check `local-aws-prom/infrastructure/main.tf` to see the
      # tag being set.
      - source_labels:
        - '__meta_ec2_tag_tips_ops_node_type'
        target_label:  'tips_ops_node_type'
You can see that there I retrieve a custom tag that I set in the machine and then enhance the metrics with it. That tag, however, comes from ec2_sd (the EC2 service discovery).
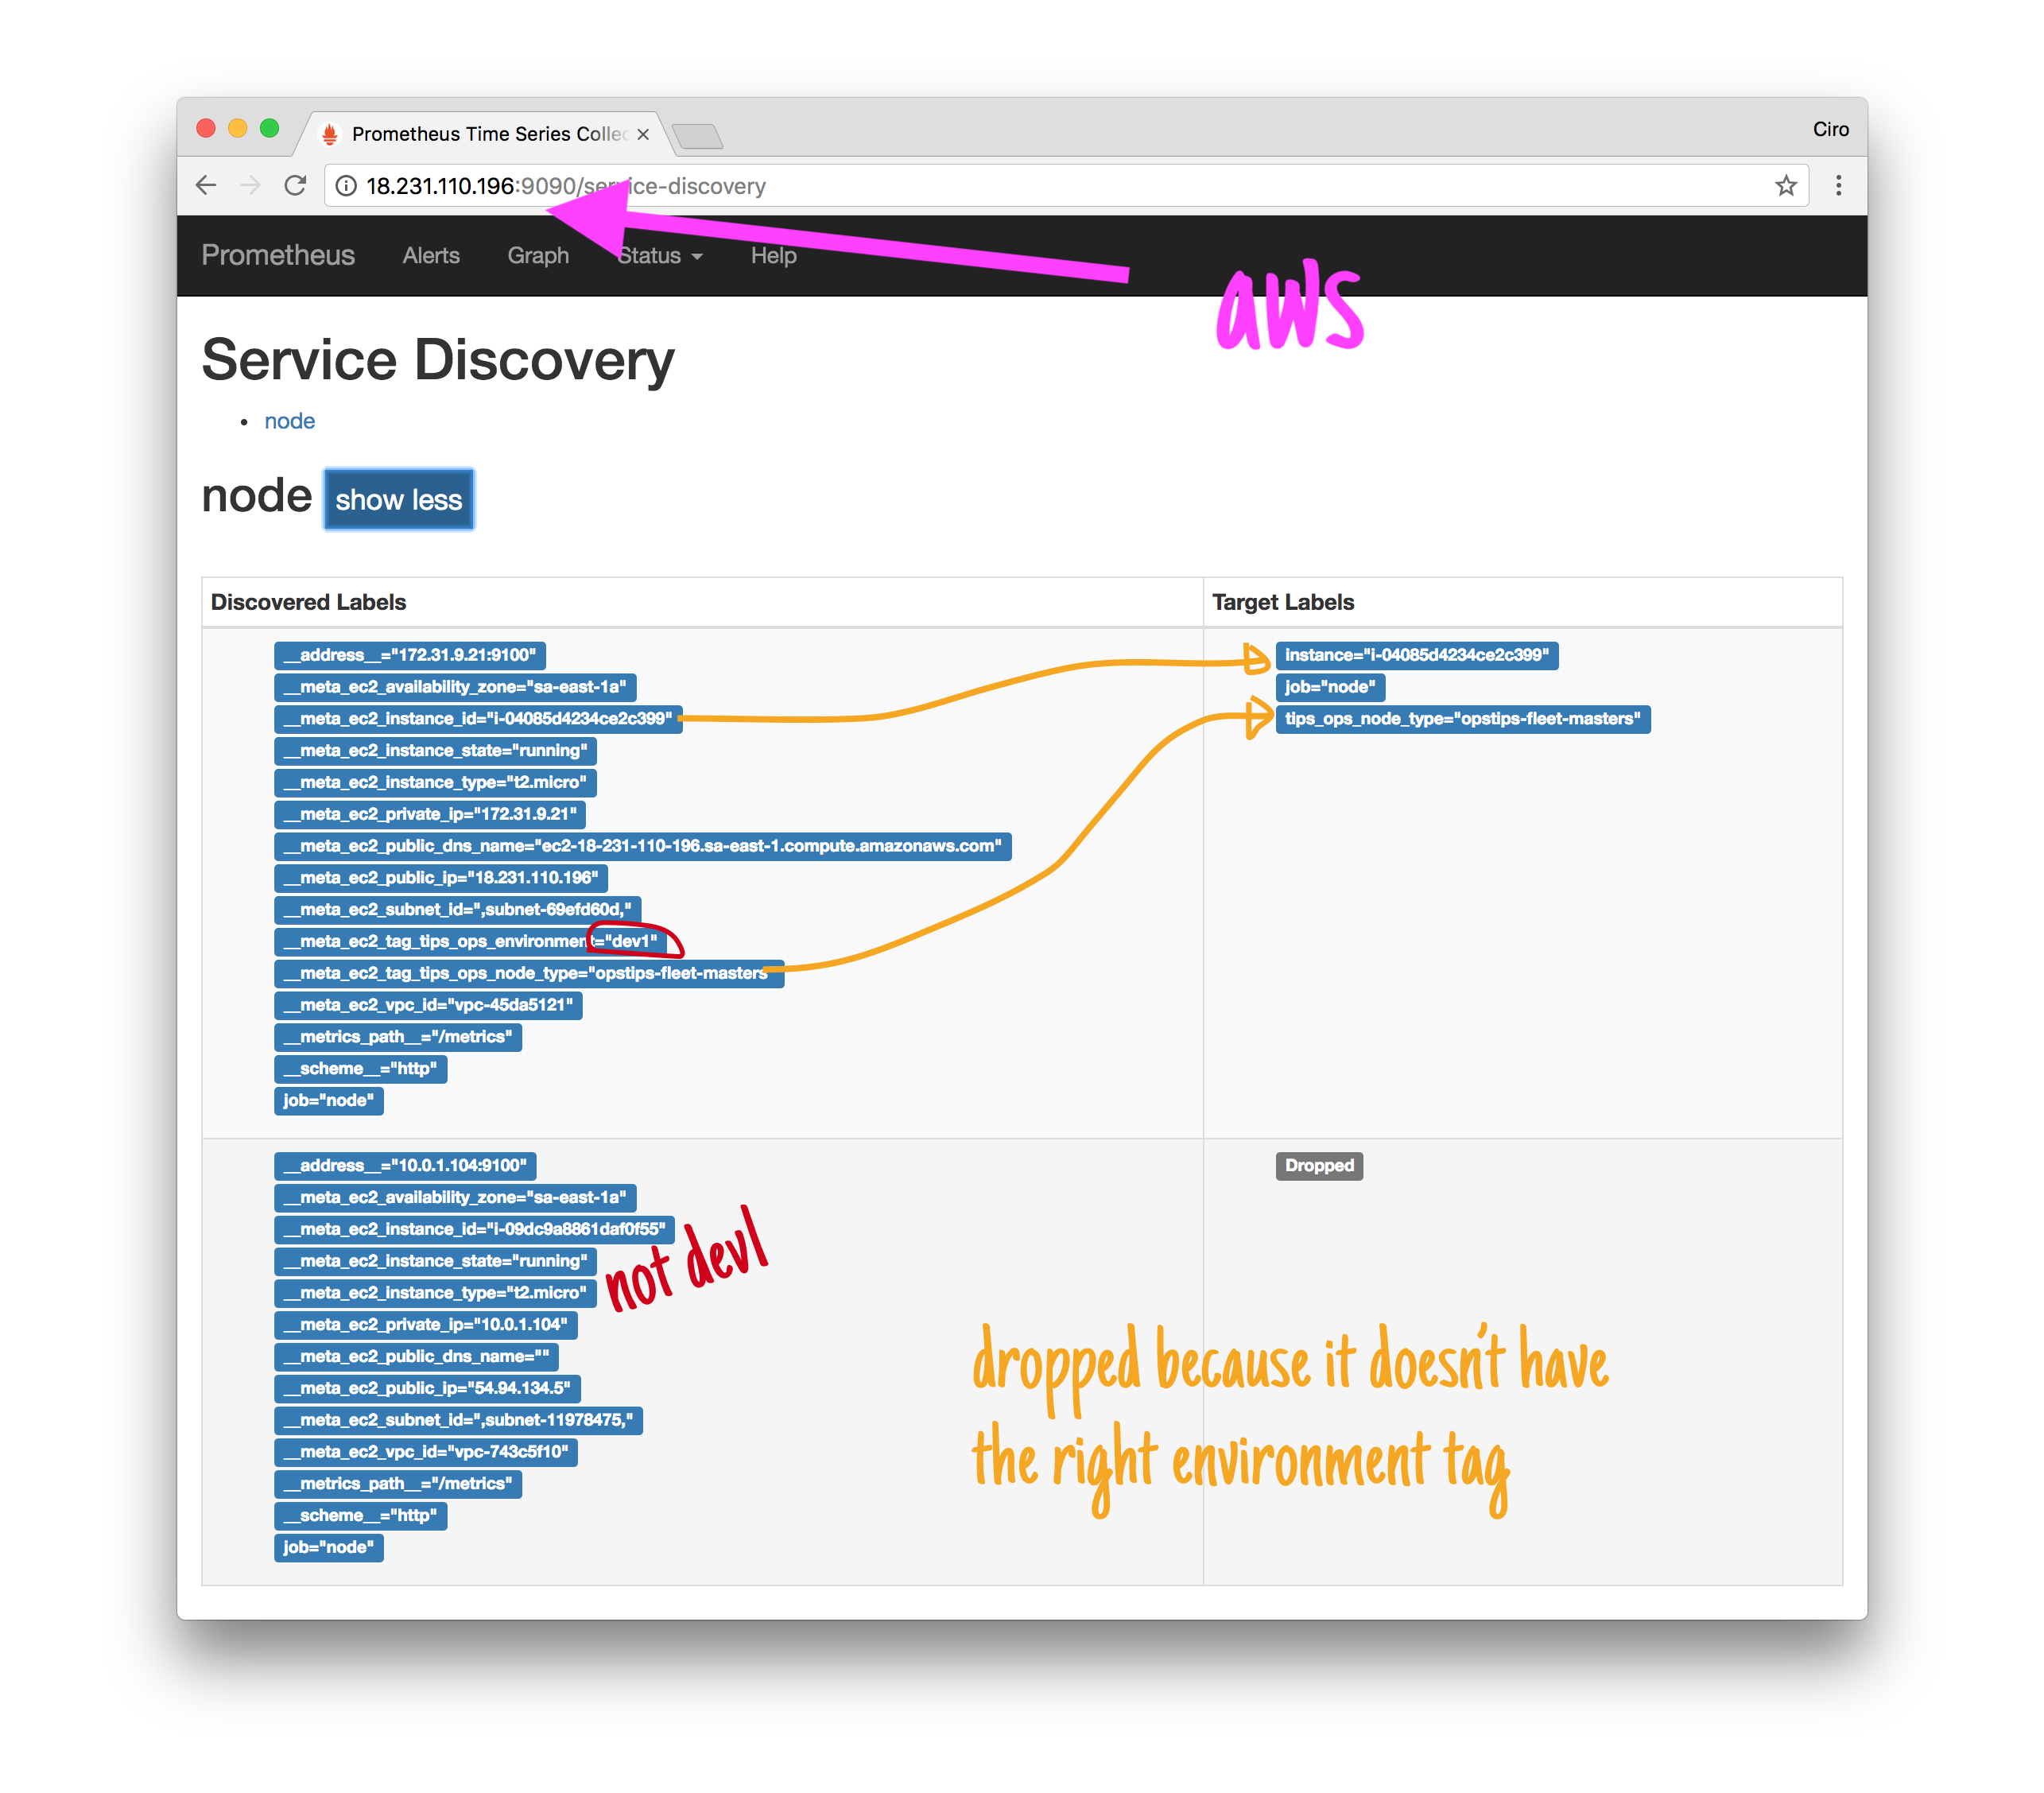
Once Prometheus starts with such configuration, we can see our relabelling taking place. Having two instances, one with the proper tags and another without, the first gets accepted and the second, dropped.
More than that, the first gets some extra labels extracted from the EC2 tags.
Preparing the local configuration
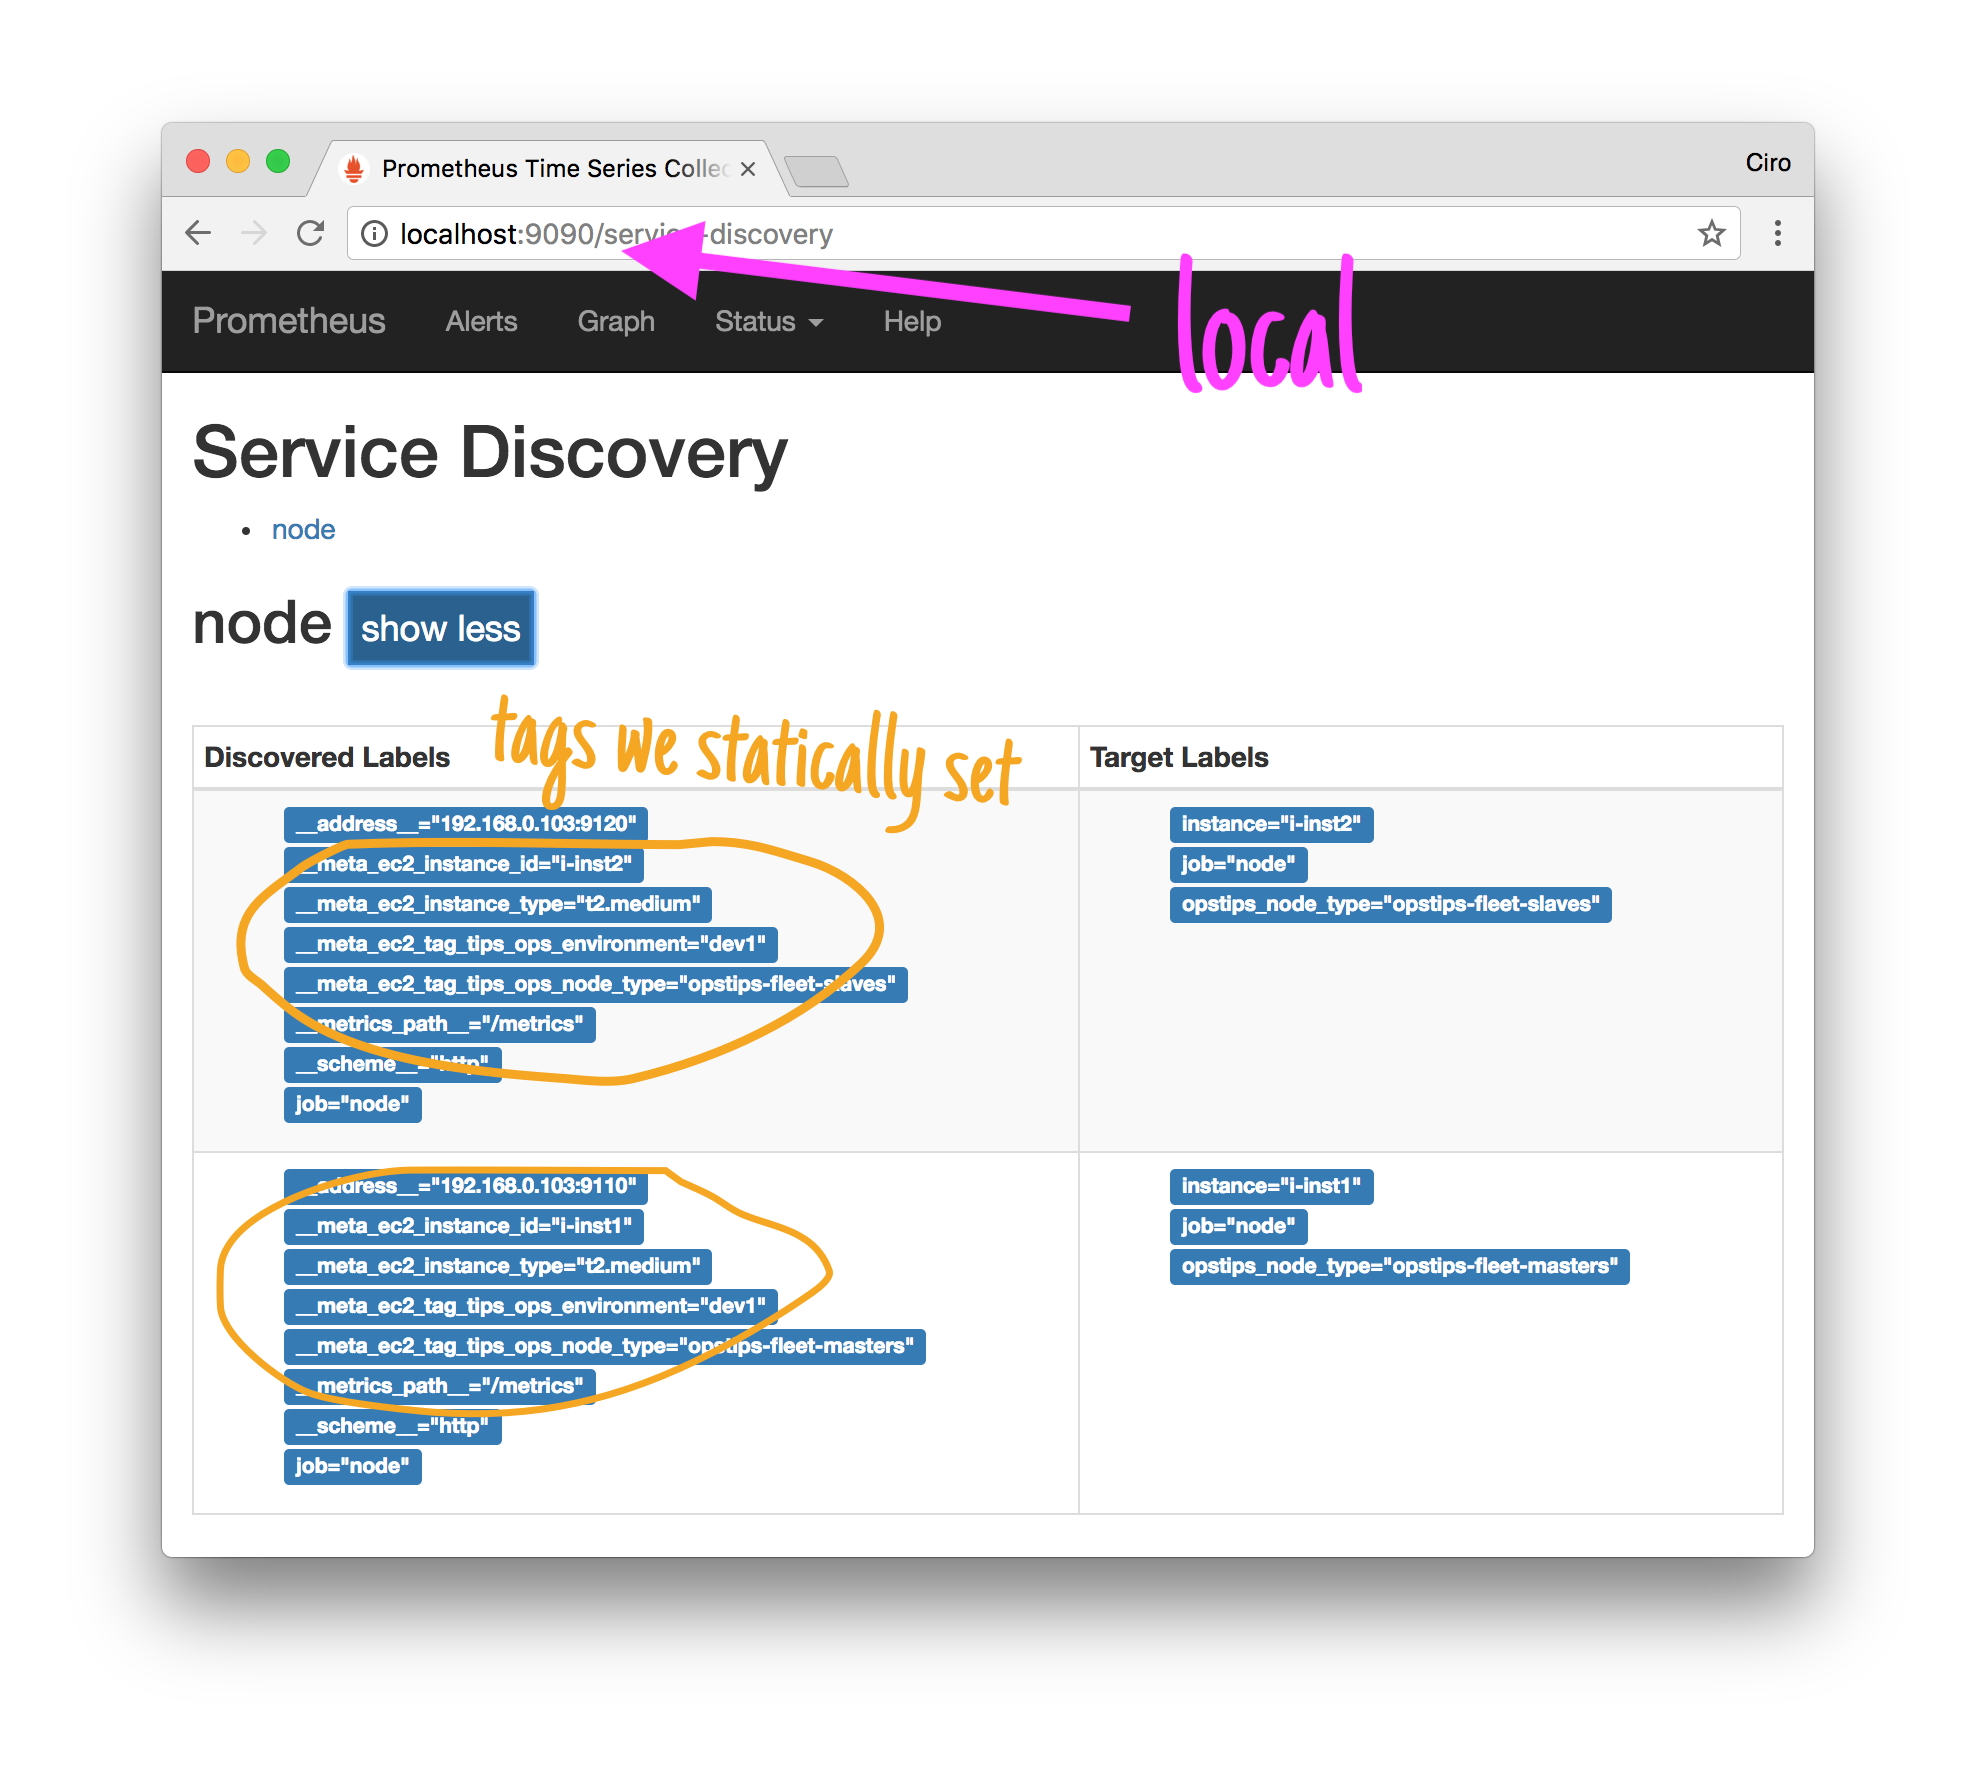
To test that locally we can use static_config labeling for each target.
For instance, this is how the Vagrant Prometheus configuration would look like:
# VAGRANT configuration

global:
  scrape_interval: '5s'
  evaluation_interval: '5s'

scrape_configs:

  # Collect metrics about the node.
  #
  # These are plain `node_exporter` metrics that
  # are scrapped to reveal all sorts of machine
  # metrics like cpu, inode utilization for each fs,
  # memory, iface statistics ...
  - job_name: 'node'

    relabel_configs:

      # Gather the instance id and use it as the name of the
      # instance.
      #
      # This allows us to not use `${ADDR}:${PORT}` in the instance
      # names but instead, the instance ID that AWS gives to us.
      #
      # In this case, a fake `i-<instance>` identifier.
      - source_labels:
        - '__meta_ec2_instance_id'
        target_label: 'instance'

      # Collect the type of the node and add it as a tag to our
      # metrics.
      #
      # This allows us to make use of node types in our
      # queries and dashboards (e.g., if you want to graph the
      # average CPU usage of a specific machine type like
      # m4.4xlarge)
      - source_labels:
        - '__meta_ec2_tag_tips_ops_node_type'
        target_label:  'opstips_node_type'


    # Machine configuration acting as if we were in aws.
    #
    # This has the effect of emulating the AWS labels that
    # the aws service discovery would give us.
    #
    # Note that here I'm setting more information
    # than I actually use - not all of these are
    # being used in the relabelling phase so those
    # not used will be dropped and not persisted.
    #
    # Because I'm simulating a two-node scenario
    # I'm listing only 2 static addresses here with
    # the desired labels. If you needed to test against more
    # VMs, this would need to be updated. Probably a better
    # way would be setting up DNS service discovery with
    # a custom DNS server locally.
    static_configs:
      - targets:
        - '${MACHINE_IP}:9110'
        labels:
          __meta_ec2_tag_tips_ops_environment: 'dev1'
          __meta_ec2_tag_tips_ops_node_type: 'opstips-fleet-masters'
          __meta_ec2_instance_type: 't2.medium'
          __meta_ec2_instance_id: 'i-inst1'

      - targets:
        - '${MACHINE_IP}:9120'
        labels:
          __meta_ec2_tag_tips_ops_environment: 'dev1'
          __meta_ec2_tag_tips_ops_node_type: 'opstips-fleet-slaves'
          __meta_ec2_instance_type: 't2.medium'
          __meta_ec2_instance_id: 'i-inst2'
To have two machines running with node_exporter I setup a little Vagrantfile which would provision them as wanted:
# Provisioning script that downloads the node_exporter
# binary from the GitHub releases page and then initiates
# it with a simple `nohup`.
#
# ps.:  for something more robust you'd typically prepare
#       a systemd service and have it enabled to keep it running
#       even between restarts.
$script = <<SCRIPT
URL=https://github.com/prometheus/node_exporter/releases/download/v0.15.2/node_exporter-0.15.2.linux-amd64.tar.gz

curl \
    -o /tmp/node_exporter.tgz \
    -SL \
    $URL

tar \
    xzf /tmp/node_exporter.tgz \
    -C /tmp/ \
    --strip-components=1

nohup /tmp/node_exporter &
SCRIPT


# Prepare the machine configurations.
# Here I'm statically configuring what are the ports
# that will be exposed such that in our prometheus configuration
# we can target them directly without needing DNS or any other
# discovery mechanisms.
Vagrant.configure(2) do |config|
  config.vm.box = "ubuntu/artful64"
  config.vm.box_check_update = false
  config.vm.synced_folder ".", "/vagrant", disabled: true
  config.vm.provision "shell", inline: $script

  config.vm.define "machine1" do |machine1|
    machine1.vm.network "forwarded_port", guest: 9100, host: 9110
  end

  config.vm.define "machine2" do |machine2|
    machine2.vm.network "forwarded_port", guest: 9100, host: 9120
  end

  config.vm.provider "virtualbox" do |v|
    v.memory = 512
    v.cpus = 1
  end
end
After a vagrant up, we should have both machines running with node_exporter in the respective ports:
curl localhost:9110/metrics
# HELP go_gc_duration_seconds A summary of the GC invocation durations.
# TYPE go_gc_duration_seconds summary
go_gc_duration_seconds{quantile="0"} 0
...

curl localhost:9120/metrics
# HELP go_gc_duration_seconds A summary of the GC invocation durations.
# TYPE go_gc_duration_seconds summary
go_gc_duration_seconds{quantile="0"} 0
...
Now get prometheus up (in my case I tailored a Dockerfile that takes care of adding the right configuration depending on the environment - aws or vagrant), and we should be able to see the targets:
And, that’s it!
With the targets being properly scrapped and with Prometheus performing the right label transformation, we’re all set.
A Grafana dashboard that makes use of those labels would be able to run properly against both AWS and local instances.
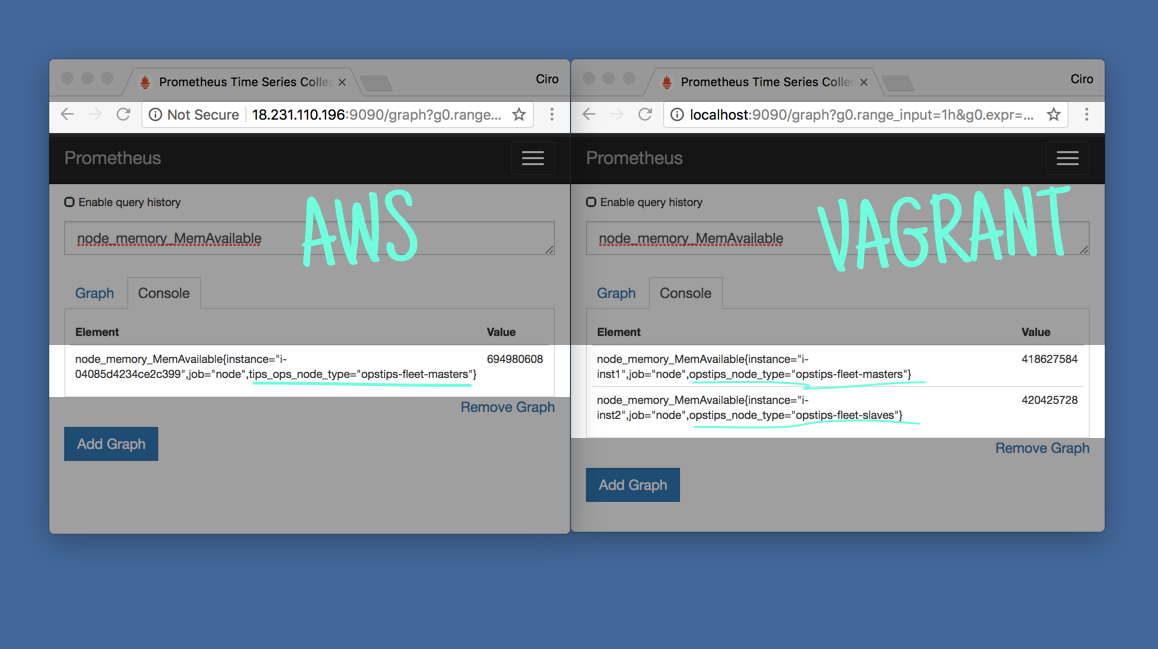
As it can be seen in the above comparison, the labeling works great.
Closing thoughts
Even though it’s fairly simple to get some instances running in AWS to prepare dashboards and test Prometheus alert rules, I find useful to be able to run it locally. With a set up like this, you can test relabelling easily without the need of any AWS instances.
Naturally, this technique can be applied to other cloud providers.
Have you been monitoring instances in AWS with Prometheus? Did you spot a mistake in the article? Please let me know!
I’m cirowrc on Twitter and would be very happy to answer any questions or just hear something about the article.
Thanks!
Have a good one,
finis