Hey,
this week the team behind Grafana released a beta release of Grafana v5 (which is almost there - check the milestone) and I got very happy to know that now it’s easier to get an instance from ground up without having to use the UI to configure the dashboards.
The niceness of that feature is that now you can redeploy a Grafana container that has a bunch of dashboards without needing to go through the UI to configure them.

While previously you’d had to manually import dashboards and configure the data sources using the UI, now it’s all declarative.
Here I’ll go through an example where I set up Prometheus as Grafana’s source such and then perform the dashboard initialization without using the UI.
If you’re only concerned with the Grafana initialization and want to skip Prometheus, go to the Configuring Grafana section.
- Setting the stage
- Configuring Prometheus
- Configuring Grafana
- Example
- Updating dashboards
- Scripting dashboard retrieval
- Closing thoughts
Setting the stage
I created a little repository that contains some source code that can be used to check out the feature: cirocosta/sample-grafana.
It’s structured like this:
.
├── Makefile
├── docker-compose.yml          # docker-compose file that
│                               # aggregates `prometheus`,
│                               # `node_exporter` and `grafana`.
│
├── grafana                     # Grafana config
│   ├── Dockerfile              # Dockerfile that adds config to the image
│   ├── config.ini              # Base configuration
│   ├── dashboards              # Pre-made dashboards
│   │   └── mydashboard.json    # Sample dashboard
│   └── provisioning            # Configuration for automatic provisioning at
│       │                       # grafana startup.
│       ├── dashboards
│       │   └── all.yml         # Configuration about grafana dashboard provisioning
│       └── datasources
│           └── all.yml         # Configuration about grafana data sources provisioning
│
└── prometheus                  # Prometheus config
    ├── Dockerfile
    └── config.yml
The docker-compose.yml file that aggregates the three containers works like this:
version: '3.3'
services:

  # Prometheus uses the image resulting form the build
  # of `./prometheus` which simply packs some configuration
  # into the form of an image.
  #
  # It could instead, use volume-mounts.
  prometheus:
    build: './prometheus'
    container_name: 'prometheus'
    ports:
      - '9090:9090'

  # The grafana container uses the image resulting from the build
  # of `./grafana` which simply packs some configuration into the
  # form of an image.
  #
  # This could instead be a volume-mounted container.
  grafana:
    build: './grafana'
    container_name: 'grafana'
    ports:
      - '3000:3000'

  # You'd typically not run `node_exporter` in a container like
  # this.
  # If so, make sure you're using `network_mode=host` to give the
  # host network namespace to the containers as well as `pid=host`.
  #
  # Eventually it would also make sense to extend it with other
  # privileges and mounts.
  #
  # I've never run it in a container so I can't endorse doing so.
  node_exporter:
    image: 'quay.io/prometheus/node-exporter'
    container_name: 'node_exporter'
With that we end up with the following scenario:

Note that there’s an extra component: database.
Grafana records dashboard modifications, alerts, organizations, users, and more (see grafana/pkg/services/sqlstore). All of this needs some persistence.
In the past, Grafana used to use Elasticsearch for that (it was more like a Kibana extension back then). Nowadays, when nothing is configured, a sqlite3 database is created by the Grafana binary, but you’re also free to use either mysql or postgresql as external databases.
Configuring Prometheus
To have a well configured datasource, Prometheus needs some configuration (checkout the configuration at sample-grafana/prometheus/config.yml):
global:
  scrape_interval: '5s'
  evaluation_interval: '5s'

scrape_configs:

  # `node` takes care of scraping node_exporter instances
  # that gives us all sorts of information about the host
  # in which the exporter runs.
  - job_name: 'node'
    static_configs:

      # Given that we're only testing a single instance that
      # we know the address very well, statically set it here
      # with a custom instance label so that it looks better
      # in the ui (and metrics).
      - targets:
        - 'node_exporter:9100'
        labels:
          instance: 'instance-1'
This allows us to query Prometheus and get the metrics from node_exporter that get the scrape targets registered with the node job:
curl http://localhost:9090/api/v1/query\?query\=node_memory_MemAvailable

{
    "data": {
        "result": [
            {
                "metric": {
                    "__name__": "node_memory_MemAvailable",
                    "instance": "instance-1",
                    "job": "node"
                },
                "value": [
                    1518184109.51,
                    "7857156096"
                ]
            }
        ],
        "resultType": "vector"
    },
    "status": "success"
}
If you’re new to Prometheus, I highly recommend Prometheus: Up & Running from Brian Brazil.
Now we’re set to go configure Grafana.
Configuring Grafana
The new release of Grafana introduced and extra configuration path: provisioning.
########## Paths ###########
[paths]
# folder that contains provisioning config files
# that grafana will apply on startup and while running.
provisioning = conf/provisioning
This provisioning directory can have other two directories inside it:
datasources: holds a list of.yamlfiles that configure data sources (e.g,Prometheusinstance …).dashboards: holds a list of.yamlfiles with configuration files that tell Grafana where to look for dashboards to initialize on startup;
Starting with datasources, this is where I tell Grafana where it should look for Prometheus:
# provisioning/datasources/all.yml
# https://github.com/cirocosta/sample-grafana/blob/master/grafana/provisioning/datasources/all.yml

datasources:
-  access: 'proxy'                       # make grafana perform the requests
   editable: true                        # whether it should be editable
   is_default: true                      # whether this should be the default DS
   name: 'prom1'                         # name of the datasource
   org_id: 1                             # id of the organization to tie this datasource to
   type: 'prometheus'                    # type of the data source
   url: 'http://prometheus:9090'         # url of the prom instance
   version: 1                            # well, versioning
With that set, whenever Grafana starts up it picks the datasource (see pkg/services/provisioning/datasources if you want to know more by checking the source code) and applies it to its database.
ps.: This datasources file can also contain a delete_datasources object which would tell Grafana about datasources to remove from its database (assuming you’re not starting from a fresh database).
As just having the data source is not enough, we’d then configure the provisioning/dashboards directory. There you can add a file describing how Grafana can pick dashboards whenever it starts up.
# provisioning/dashboards/all.yml
# https://github.com/cirocosta/sample-grafana/blob/master/grafana/provisioning/dashboards/all.yml

- name: 'default'       # name of this dashboard configuration (not dashboard itself)
  org_id: 1             # id of the org to hold the dashboard
  folder: ''            # name of the folder to put the dashboard (http://docs.grafana.org/v5.0/reference/dashboard_folders/)
  type: 'file'          # type of dashboard description (json files)
  options:
    folder: '/var/lib/grafana/dashboards'       # where dashboards are
With that configured, make sure your dashboards are in the place they should be (/var/lib/grafana/dashboards in this example) and you’re ready to go.
Example
Clone the cirocosta/sample-grafana repository.
This repository contains the file structure described above.
With make run you can take the infrastructure up (node_exporter, grafana and prometheus) if you have docker and docker-compose installed.
# clone the repo and get there
git clone https://github.com/cirocosta/sample-grafana
cd ./sample-grafana

# run the infra
make run

# open the grafana web page
open http://localhost:3000
Now you should see a login screen (which you can enter with admin as user and admin as password).
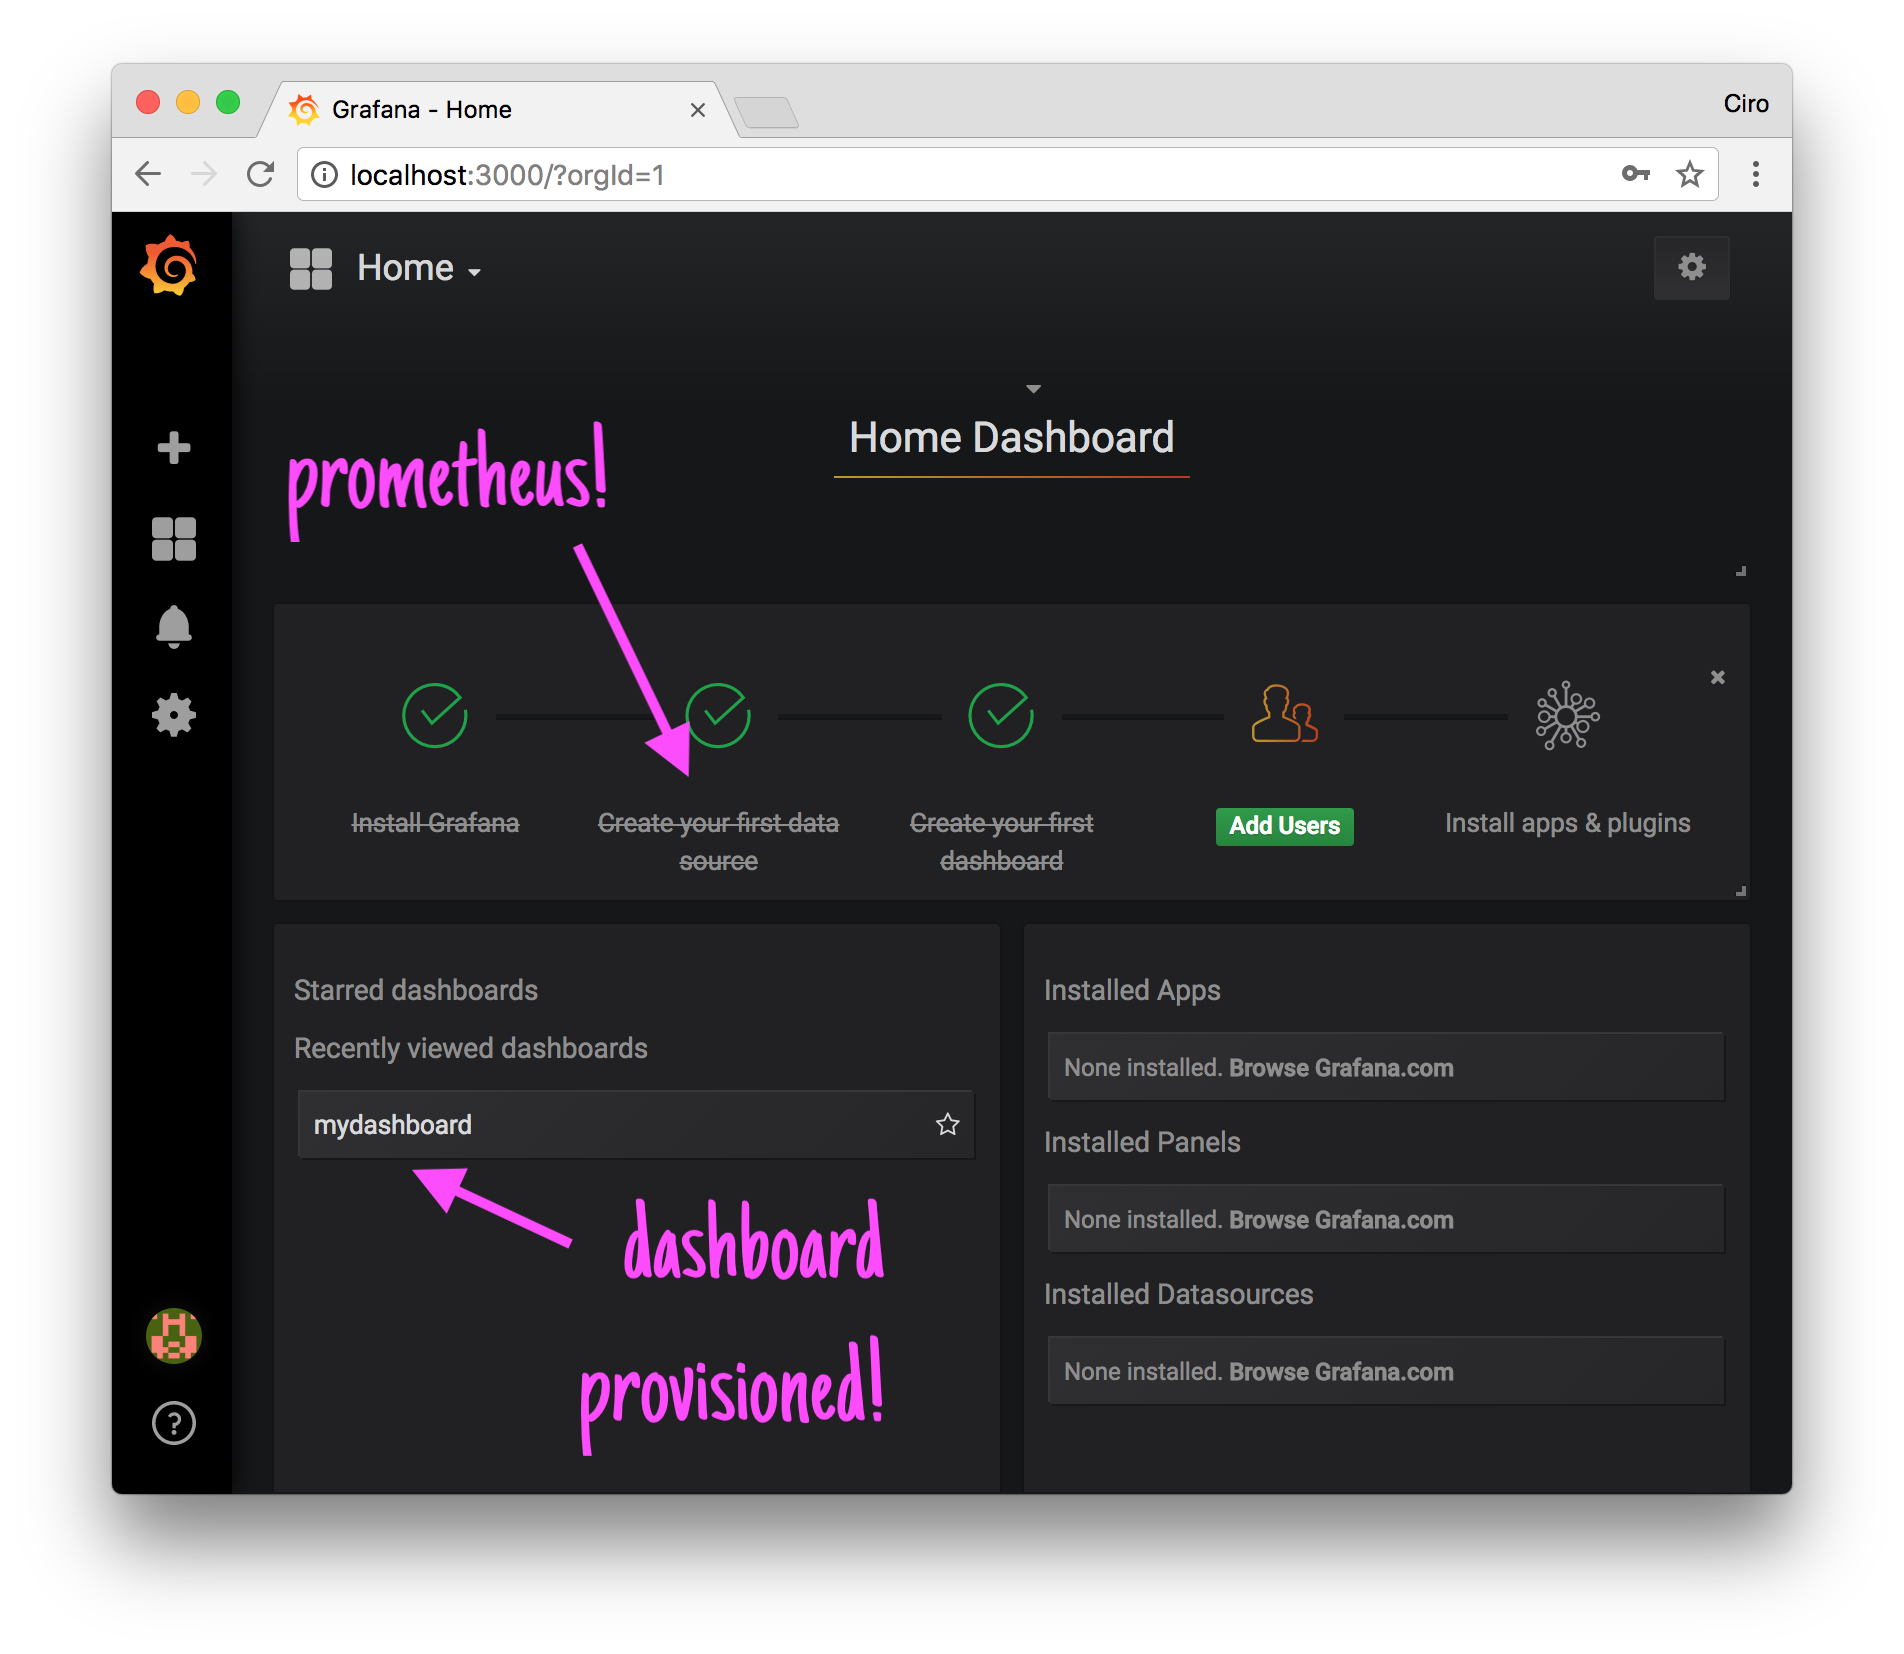
After logged in, voilà, the datasource has been already configured and you already have a dashboard (mydashboard) set:

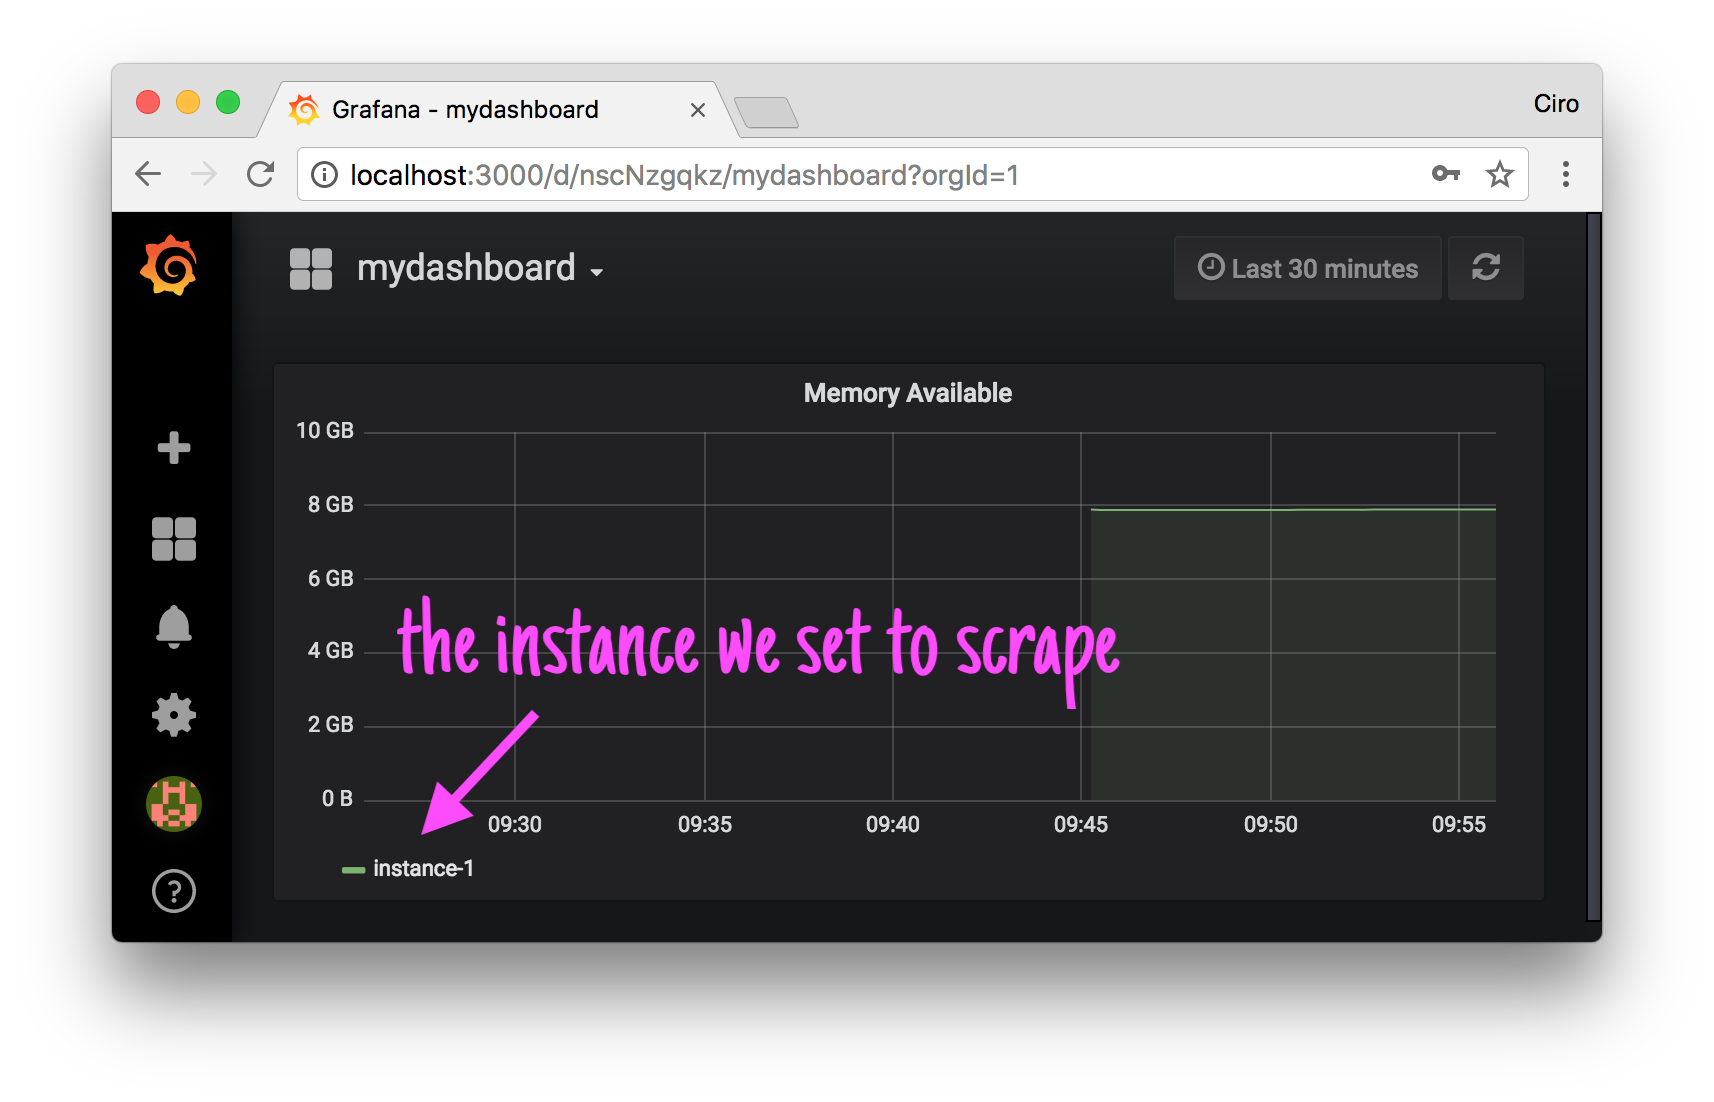
Heading towards the dashboard, we can see that our scrape target is really being scraped and that Grafana is properly retrieving the information it needs from Prometheus (as the data source has been properly configured):

Updating dashboards
As the files that represent the dashboards are all JSON files, the easiest way to get them with the modifications you performed is targetting the Grafana API with your credentials and saving the JSON files to the directory.
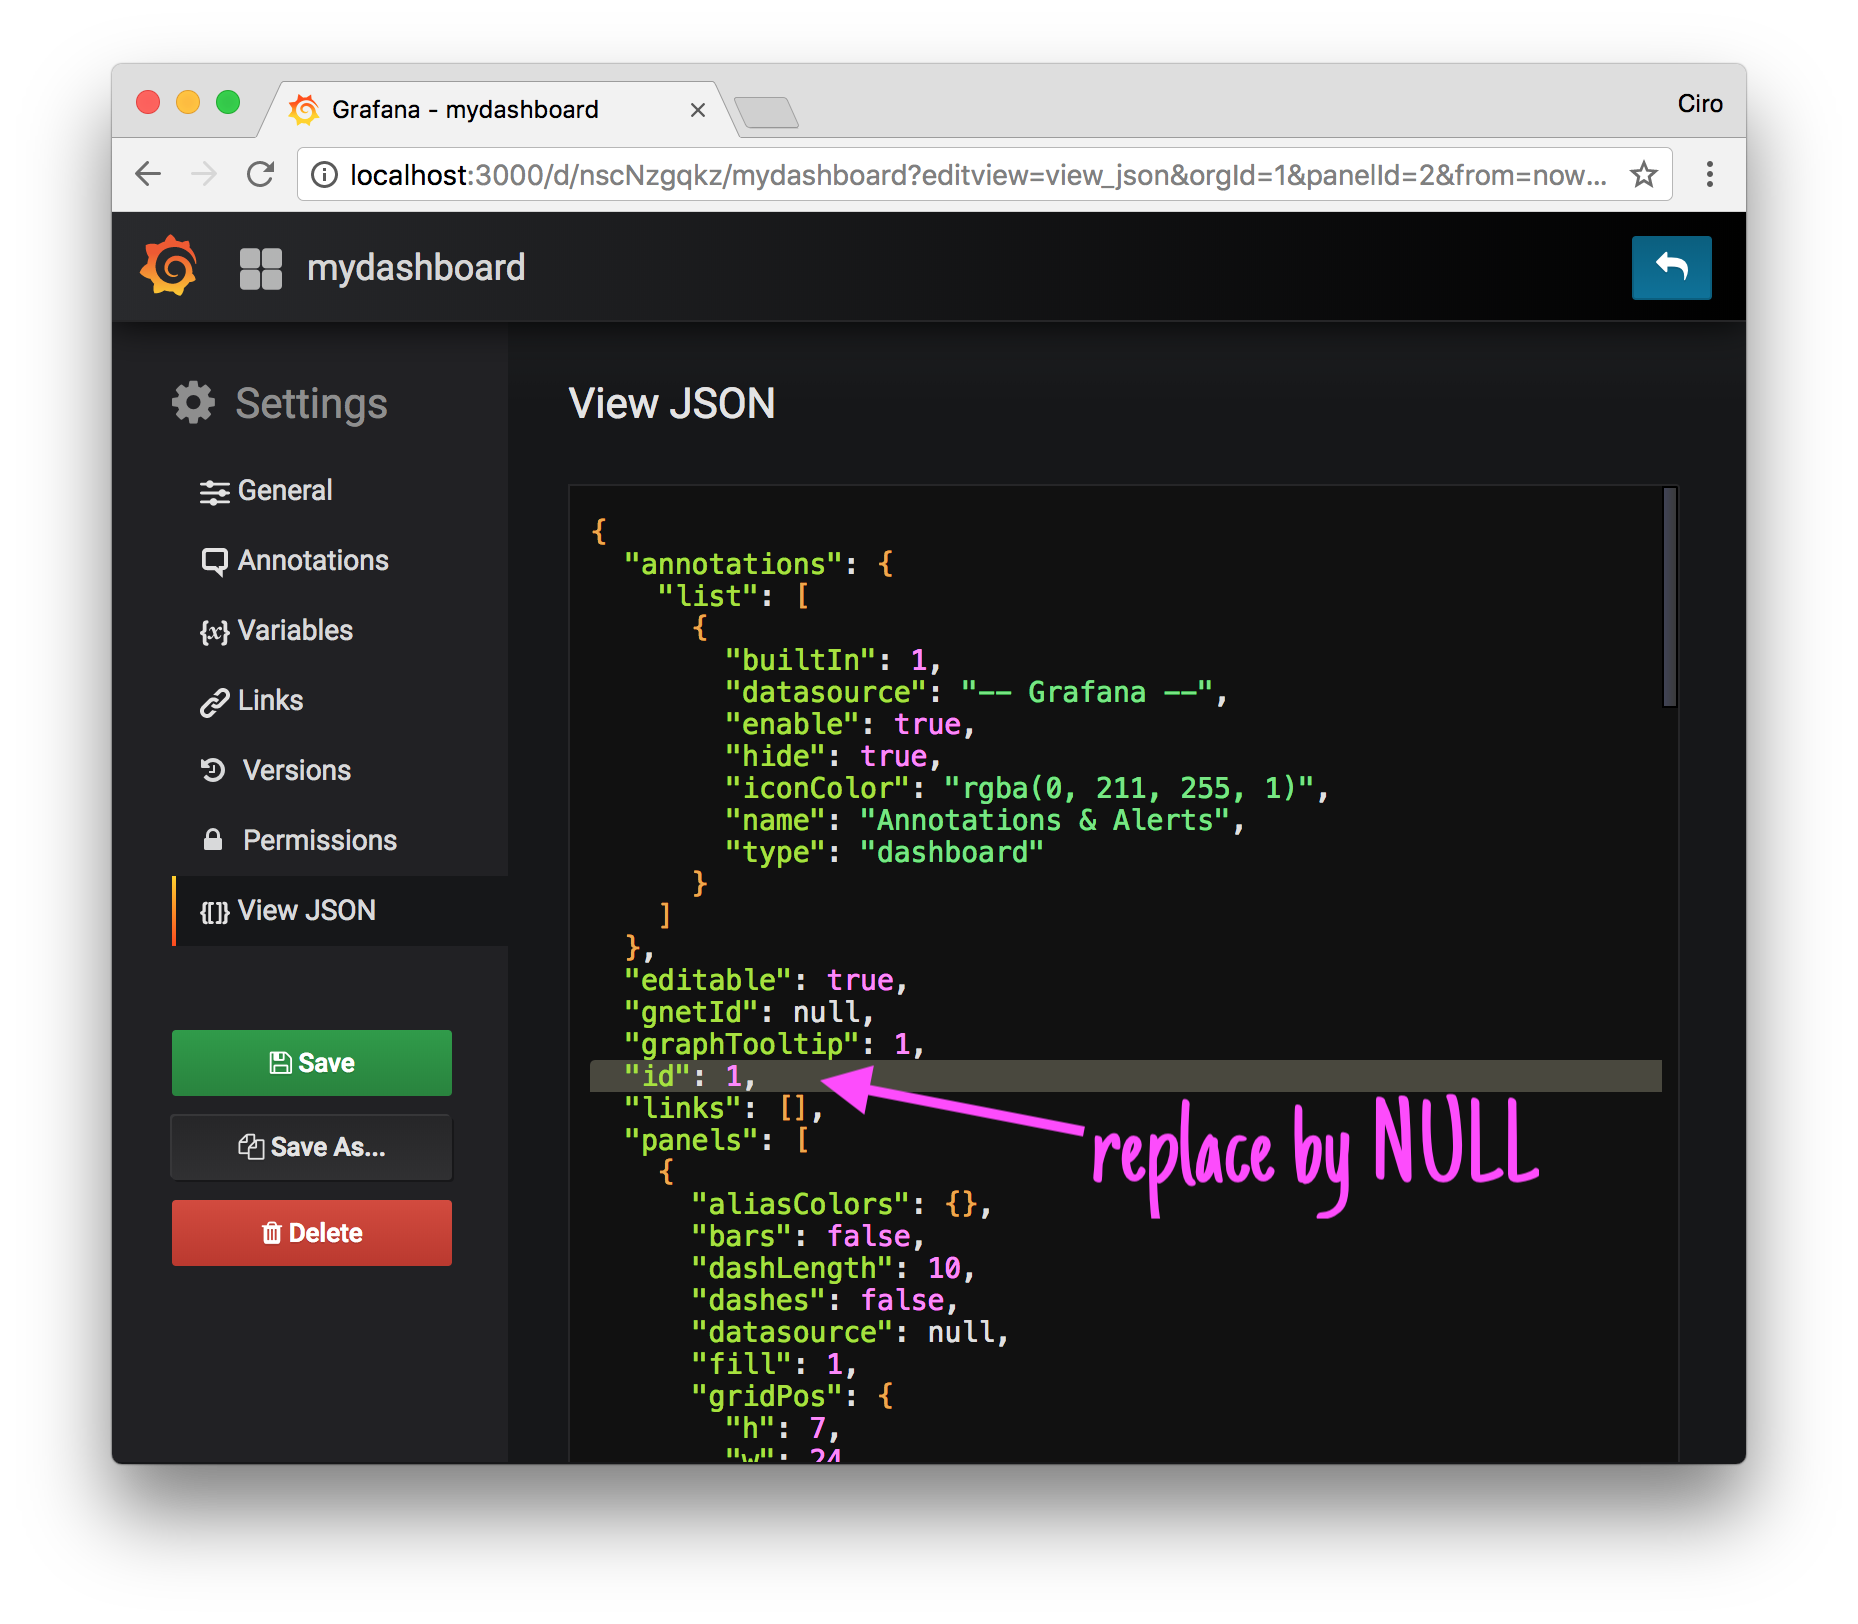
If you’re managing just one dashboard or another you can do this by hand though - go to settings and retrieve the JSON for the dashboard:

If you’re managing some more (which I guess it’s the case), there’s a better way of doing it.
Scripting dashboard retrieval
That manual process I described is not all that hard to be scripted.
By inspecting the network requests issued by the browser, we can notice that Grafana exposes some interesting endpoints via the /api path:
/api/search             allows us to retrieve different types of objects
                        related to our account / organization, including
                        one that really matters to us: dash-db (dashboards
                        db I guess)

/api/dashboards/db      retrieves the configuration of a dash-db object
(the routes are registered under grafana/grafana/pkg/api/api.go)
So the idea of the script is:
- retrieve a list of dashboard names (get it from
dash-dbobjects in the list that/api/searchgives us); - for each dashboard, get its configuration;
- save the configuration to a file in a specific location.
The script looks like this (see update-dashboards.sh):
#!/bin/bash

# Updates local dashboard configurations by retrieving
# the new version from a Grafana instance.
#
# The script assumes that basic authentication is configured
# (change the login credentials with `LOGIN`).
#
# DASHBOARD_DIRECTORY represents the path to the directory
# where the JSON files corresponding to the dashboards exist.
# The default location is relative to the execution of the
# script.
#
# URL specifies the URL of the Grafana instance.
#

set -o errexit

readonly URL=${URL:-"http://localhost:3000"}
readonly LOGIN=${LOGIN:-"admin:admin"}
readonly DASHBOARDS_DIRECTORY=${DASHBOARDS_DIRECTORY:-"./grafana/dashboards"}


main() {
  local dashboards=$(list_dashboards)
  local dashboard_json

  show_config

  for dashboard in $dashboards; do
    dashboard_json=$(get_dashboard "$dashboard")

    if [[ -z "$dashboard_json" ]]; then
      echo "ERROR:
  Couldn't retrieve dashboard $dashboard.
      "
      exit 1
    fi

    echo "$dashboard_json" >$DASHBOARDS_DIRECTORY/$dashboard.json
  done
}


# Shows the global environment variables that have been configured
# for this run.
show_config() {
  echo "INFO:
  Starting dashboard extraction.

  URL:                  $URL
  LOGIN:                $LOGIN
  DASHBOARDS_DIRECTORY: $DASHBOARDS_DIRECTORY
  "
}


# Retrieves a dashboard ($1) from the database of dashboards.
#
# As we're getting it right from the database, it'll contain an `id`.
#
# Given that the ID is potentially different when we import it
# later, to make this dashboard importable we make the `id`
# field NULL.
get_dashboard() {
  local dashboard=$1

  if [[ -z "$dashboard" ]]; then
    echo "ERROR:
  A dashboard must be specified.
  "
    exit 1
  fi

  curl \
    --silent \
    --user "$LOGIN" \
    $URL/api/dashboards/db/$dashboard |
    jq '.dashboard | .id = null'
}


# lists all the dashboards available.
#
# `/api/search` lists all the dashboards and folders
# that exist in our organization.
#
# Here we filter the response (that also contain folders)
# to gather only the name of the dashboards.
list_dashboards() {
  curl \
    --silent \
    --user "$LOGIN" \
    $URL/api/search |
    jq -r '.[] | select(.type == "dash-db") | .uri' |
    cut -d '/' -f2
}

main "$@"
Execute it with the right variables, and you’re done!
Closing thoughts
It’s very nice to see that Grafana is going.
As the de facto tool for graphing I’m very happy that Grafana has been improving so much over time. This new version is even more responsive and has this little feature that really helps.
Congratulations to everybody involved!
If you have any questions or noticed that I made a mistake somewhere, please let me know!
I’m cirowrc on Twitter.
Have a good one!
finis