Hey,
Today I was looking at the internal struct that ends up being filled as the result of parsing the Docker Registry configuration, and doing that I found that in the master branch of the repository there’s already support for metrics scraping by Prometheus (see configuration.go), something that used to be only available in OpenShift (see openshift/origin issue).
It surprised me that this addition came not super recently:
commit e3c37a46e2529305ad6f5648abd6ab68c777820a
Author: tifayuki <tifayuki@gmail.com>
Date:   Thu Nov 16 16:43:38 2017 -0800

    Add Prometheus Metrics

    at the first iteration, only the following metrics are collected:

      - HTTP metrics of each API endpoint
      - cache counter for request/hit/miss
      - histogram of storage actions, including:
        GetContent, PutContent, Stat, List, Move, and Delete

    Signed-off-by: tifayuki <tifayuki@gmail.com>
What about giving it a try?
So, first, start by building an image right from the master branch:
# Clone the Docker registry repository
git clone https://github.com/docker/distribution

# Build the registry image using the provided Dockerfile
# that lives right in the root of the project.
#
# Here I tag it as `local` just to make sure that we
# don't confuse it with `registry:latest`.
docker build --tag registry:local .
With the image built using the latest code, tailor a configuration that enables the exporter:
version: 0.1
log:
  level: "debug"
  formatter: "json"
  fields:
    service: "registry"
storage:
  cache:
    blobdescriptor: "inmemory"
  filesystem:
    rootdirectory: "/var/lib/registry"
http:
  addr: ":5000"
  debug:
    addr: ":5001"
    prometheus:
      enabled: true
      path: "/metrics"
  headers:
    X-Content-Type-Options: [ "nosniff" ]
Run the registry with this configuration and note how :5001/metrics will provide you with the metrics you expect.
# Make a request to the metrics endpoint and filter the
# output so we can see what the metrics descriptions are.
#
# ps.: each of those metrics end up expanding to multiple
# dimensions via labels.
curl localhost:5001/metrics --silent | ag registry_ | ag HELP

HELP registry_http_in_flight_requests The in-flight HTTP requests
HELP registry_http_request_duration_seconds The HTTP request latencies in seconds.
HELP registry_http_request_size_bytes The HTTP request sizes in bytes.
HELP registry_http_requests_total Total number of HTTP requests made.
HELP registry_http_response_size_bytes The HTTP response sizes in bytes.
HELP registry_storage_action_seconds The number of seconds that the storage action takes
HELP registry_storage_cache_total The number of cache request received
Wanting to see how useful these metrics can be, I set up an environment in AWS where there’s an EC2 instance with a registry instance that’s backed by an S3 bucket as the storage tier (you can check more about how to achieve it here: How to set up a private docker registry using AWS S3).
With the registry up, it was now a matter of having Prometheus and Grafana running locally so I could start making some queries:
version: '3.3'
services:

  # Create a "pod-like" container that will serve as both the
  # network entrypoint for both of the containers as well as
  # provide a common ground for them to communicate over localhost
  # (given that they'll share the same network namespace).
  pod:
    container_name: 'pod'
    ports:
      - '9090:9090'
      - '3000:3000'
    image: 'alpine'
    tty: true

  grafana:
    container_name: 'grafana'
    depends_on: [ 'pod' ]
    network_mode: 'service:pod'
    image: 'grafana/grafana:5.2.0-beta3'
    restart: 'always'

  prometheus:
    container_name: 'prometheus'
    depends_on: [ 'pod' ]
    network_mode: 'service:pod'
    image: 'prom/prometheus'
    restart: 'always'
    volumes:
      - './prometheus.yml:/etc/prometheus/prometheus.yml'
Given that prometheus is making use of a local configuration under ./prometheus.yml, this one looked like the following:
global:
  scrape_interval: '15s'
  evaluation_interval: '15s'
  scrape_timeout: '10s'

scrape_configs:
  - job_name: 'prometheus'
    static_configs:
      - targets: [ 'localhost:9090' ]

  - job_name: 'registry'
    # Here I just specified the public IP address of the
    # EC2 instance that I had holding the registry at that
    # time.
    #
    # Naturally, you wouldn't keep it open like this.
     static_configs:
      - targets: [ '52.67.104.105:5001' ]
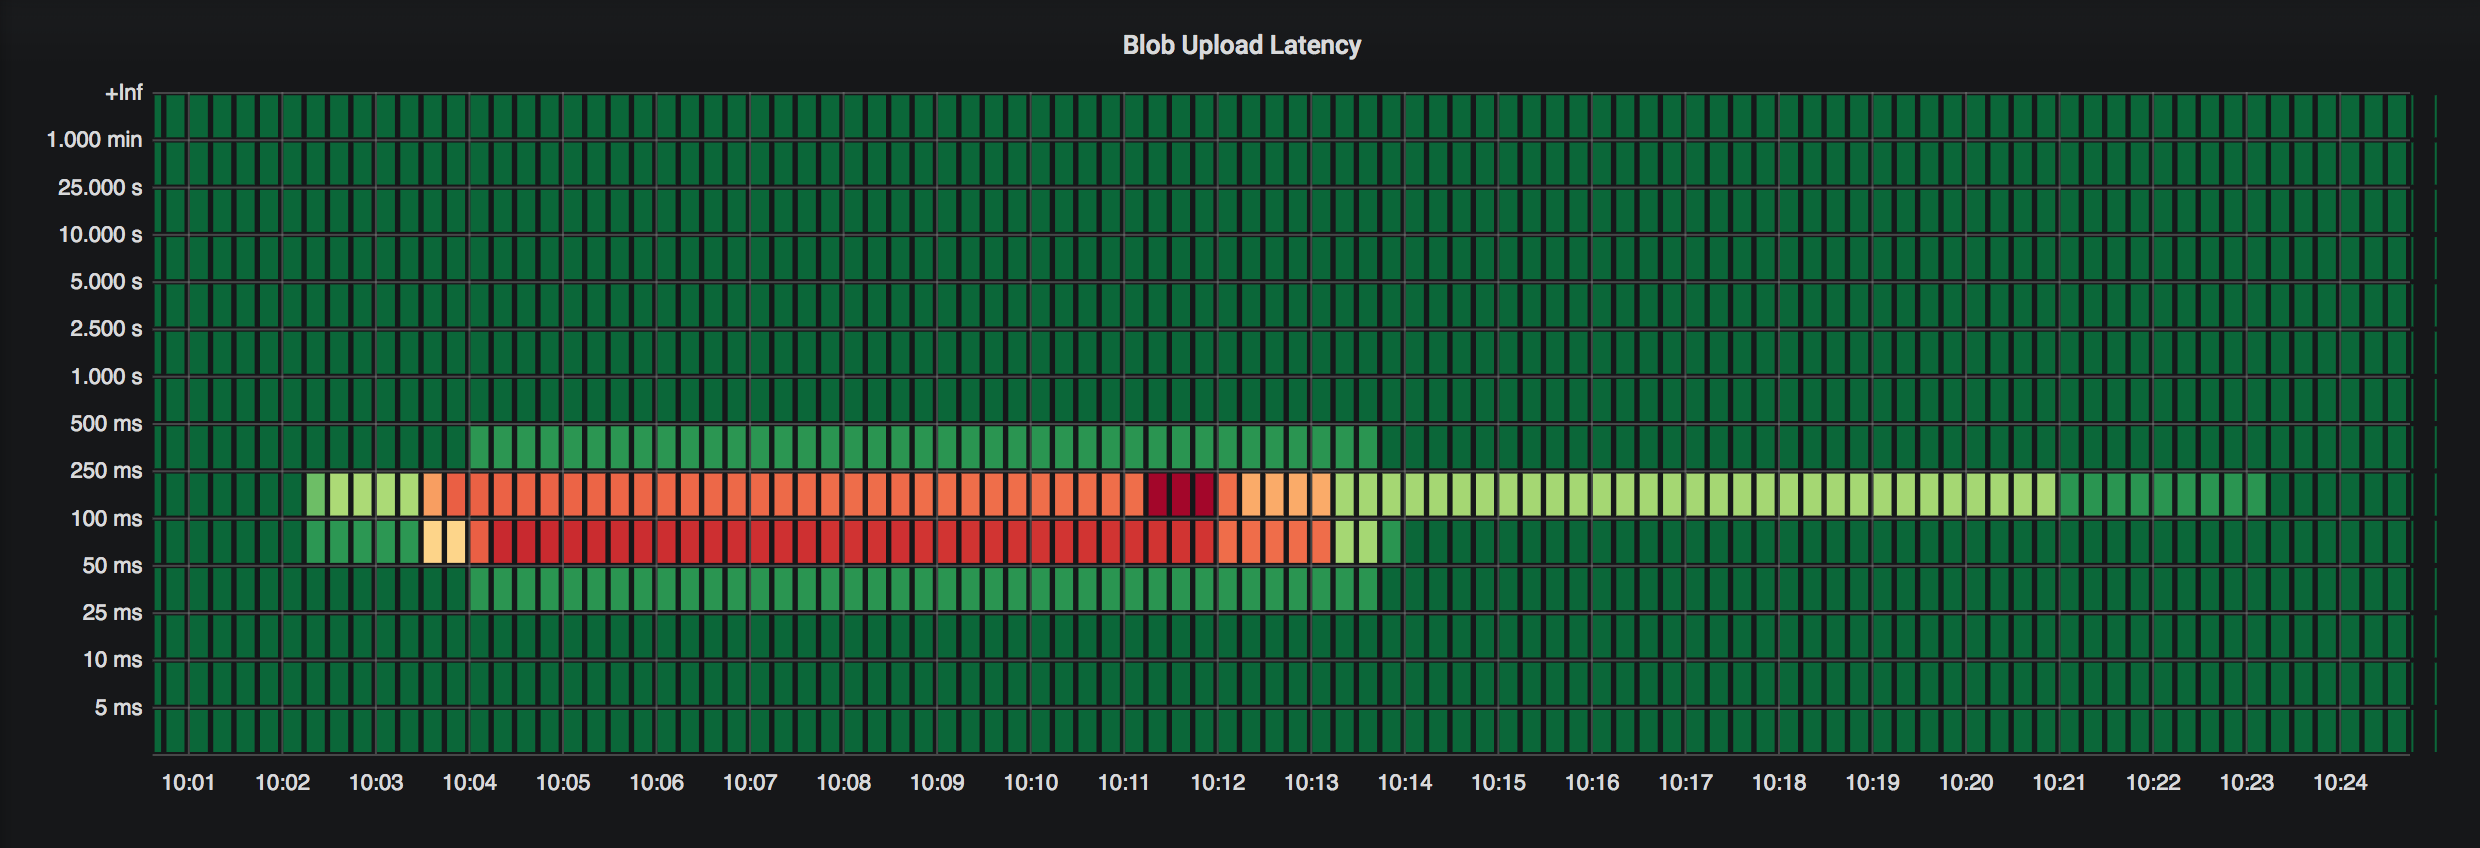
Now, to reproduce the panel showed in the beginning, head over to our grafana dashboard and create a heatmap panel with the following query:
rate(registry_http_request_duration_seconds_bucket{handler="blob_upload"}[10m])
That’s it!
If you have any questions or found something odd, please let me know! I’m cirowrc on Twitter.
Have a good one!
finis