Hey,
While people generally know (and agree) that cAdvisor is the guy in the room to keep track of container metrics, there’s a sort of hidden feature of the docker daemon that people don’t take into account: the daemon by itself can be monitored too - see Collect Docker Metrics with Prometheus.

You indeed can determine whether the daemon is running by checking the systemd metrics via cAdvisor (if you’re running the Docker daemon as a systemd service), you can’t know much more than that.
Using the native Docker daemon metrics, you can get much more.
In this post we go through:
How to turn Docker daemon metrics on
To turn the feature on, change your daemon.json (usually at /etc/docker/daemon.json) file to allow experimental features and tell it an address and path to expose the metrics.
For instance:
{
        "expermental": true,
        "metrics-addr": "0.0.0.0:9100"
}
With that done, check out whether it’s indeed exporting the metrics:
curl localhost:9100/metrics

        # HELP builder_builds_failed_total Number of failed image builds
        # TYPE builder_builds_failed_total counter
        builder_builds_failed_total{reason="build_canceled"} 0
        builder_builds_failed_total{reason="build_target_not_reachable_error"} 0
        ...
With the endpoint working, you’re now able to have Prometheus scraping this endpoint.

Gathering Docker daemon metrics on MacOS
If you’re a Docker-for-mac user, then there’s a little difference.
First, you’ll not have the /etc/docker/daemon.json file - this is all managed by the Docker mac app, which doesn’t prevent you from tweaking the daemon configurations though.
Head over to the preferences pannel:

Once there, head to the Daemon tab and switch to the advanced mode.

With that configuration set, you’re now able to properly reach the docker-for-mac daemon metrics: curl localhost:9100 from your mac terminal.
Tailoring a Docker metrics Grafana Dashboard
Once our metric collection is set up, we can now start graphing data from our Prometheus instance.
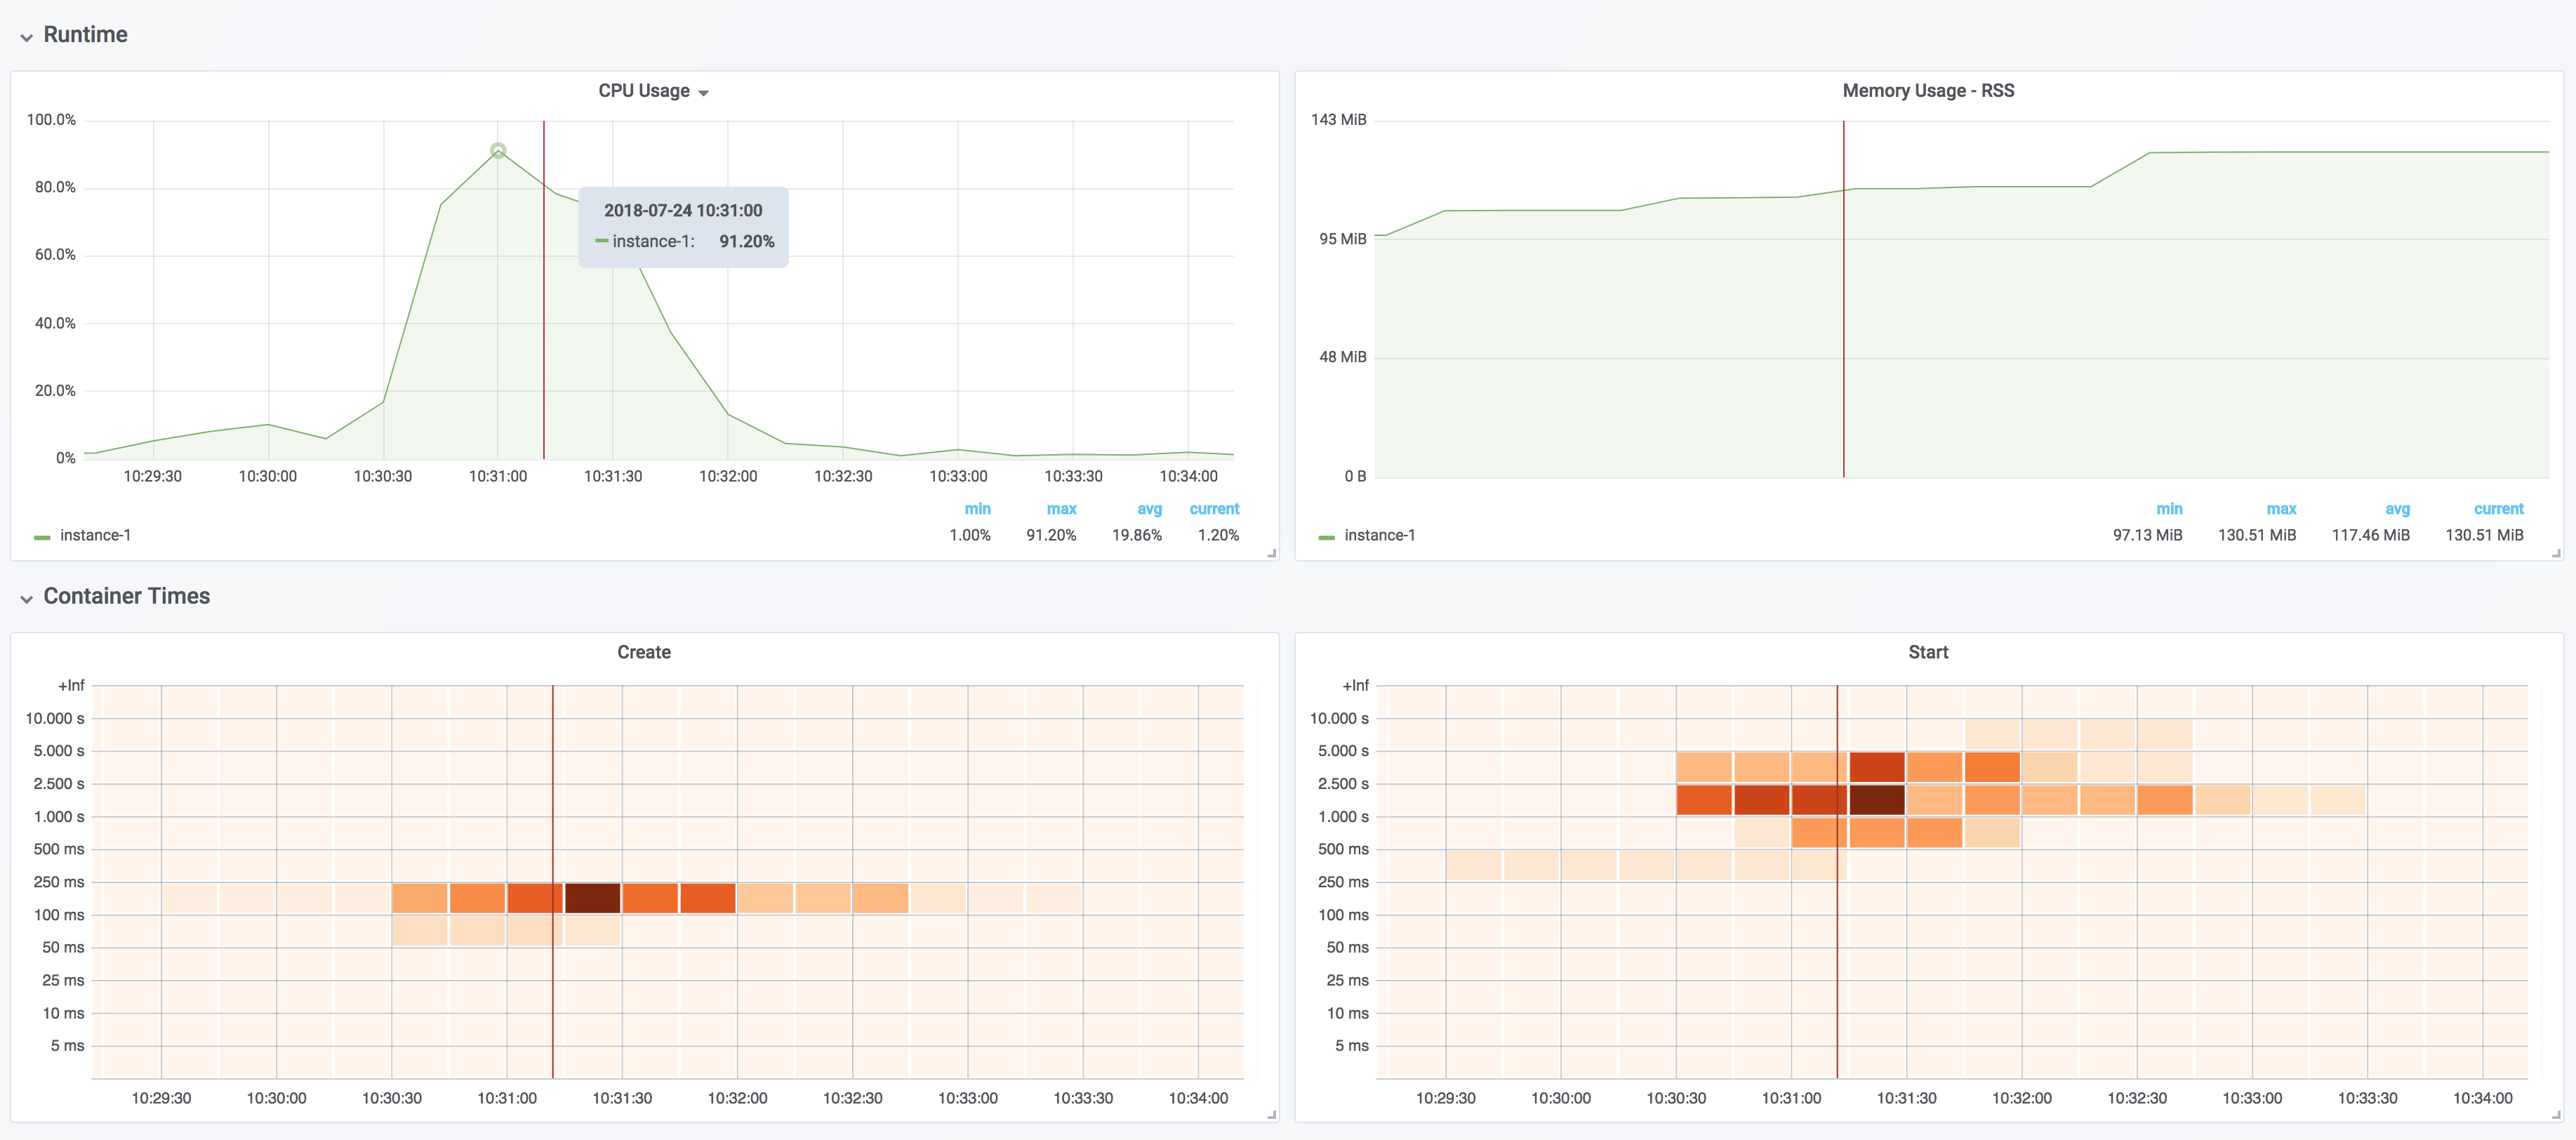
To demonstrate which kind of metrics we can retrieve, I set up a sample repository (cirocosta/sample-collect-docker-metrics) with some preconfigured dashboards that you can use right away.
There, I configured Prometheus to look for the Docker daemon at host.docker.internal, a DNS name that in a Docker for Mac installation resolves to the IP of the Xhyve VM that Docker is running on (see Networking features in Docker for Mac).
global:
  scrape_interval: '5s'
  evaluation_interval: '5s'

scrape_configs:

  - job_name: 'docker'
    static_configs:
      - targets:
        - 'host.docker.internal:9100'
        labels:
          instance: 'instance-1'
With Prometheus now scraping my Docker for Mac daemon, we can jump to the Grafana Web UI and start creating some dashboards and graphs.
Docker Daemon CPU usage
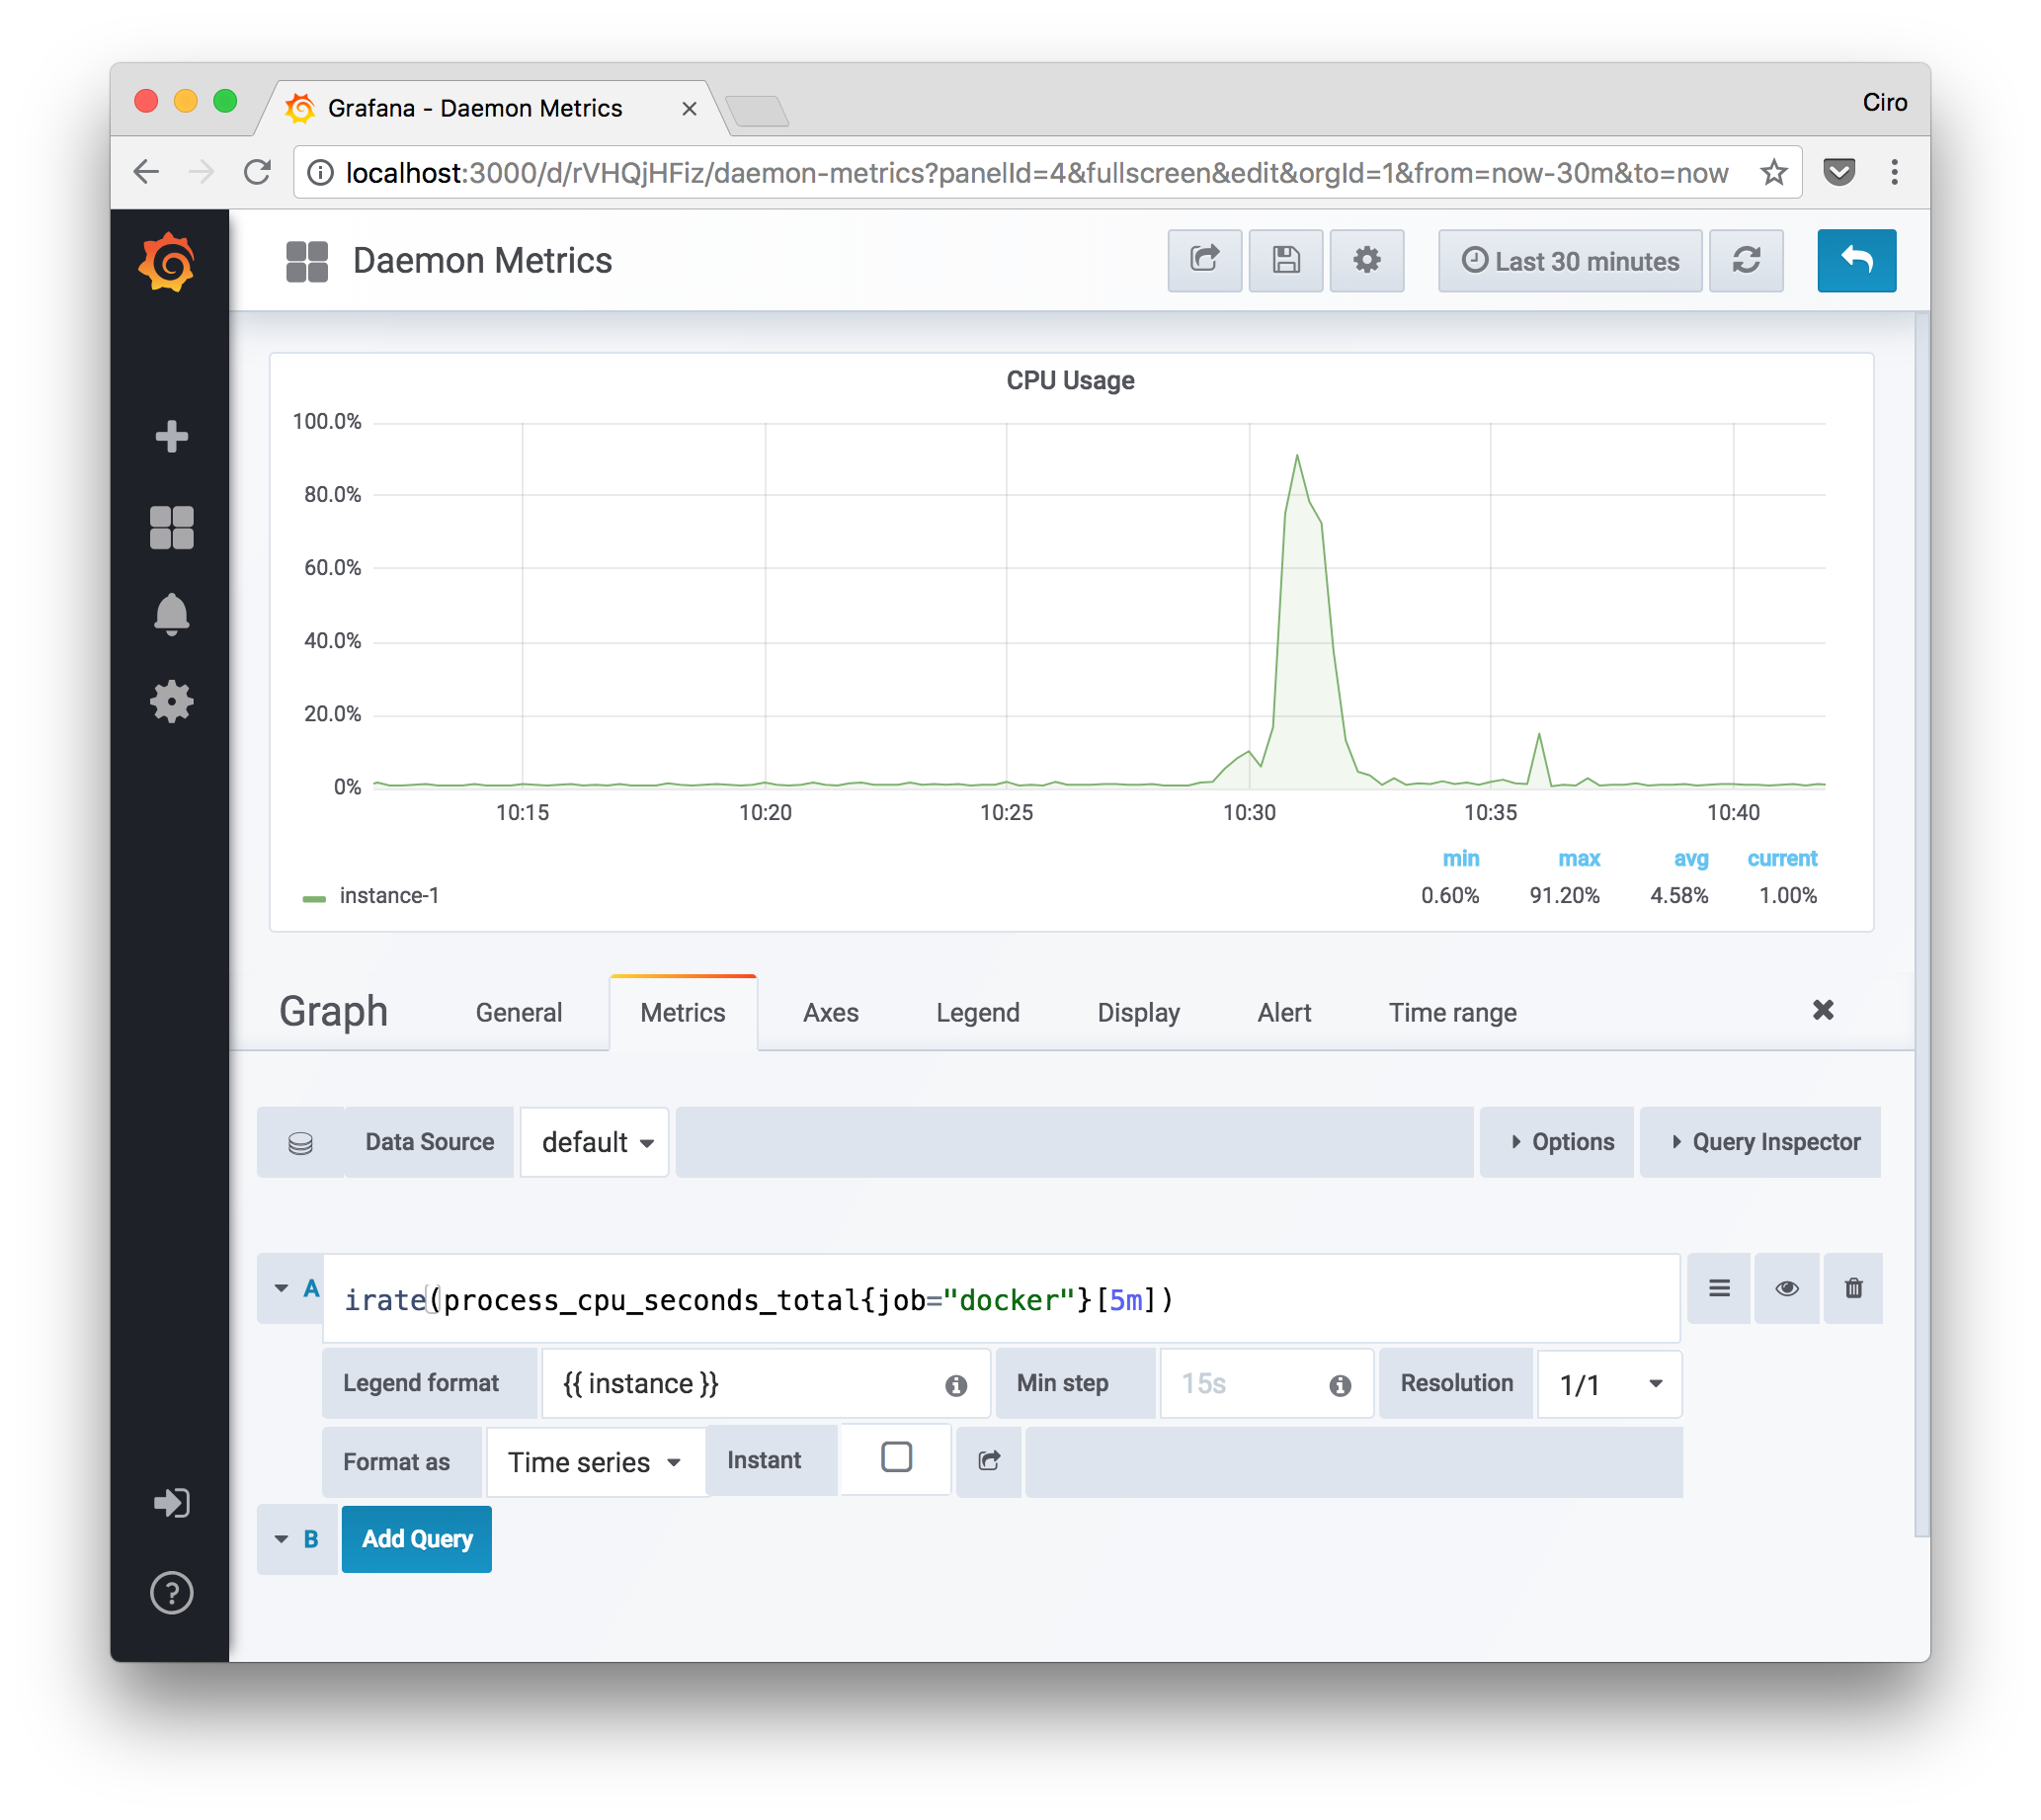
The one I started with was CPU usage to answer the question “How much CPU usage is the Docker daemon process taking”.
Given that all Prometheus Golang clients report their process CPU usage, we’re able to graph that (just like any other process level metric that are also revealed by Prometheus clients).
From the Prometheus documentation, these are:
Knowing that, we can then graph the CPU usage of the dockerd process:

What the query does is:
- it grabs the total CPU seconds spent by the Daemon process, then
- calculates the per-second instantaneous rate from the five-minutes vector of CPU seconds.
Docker container start times heatmap
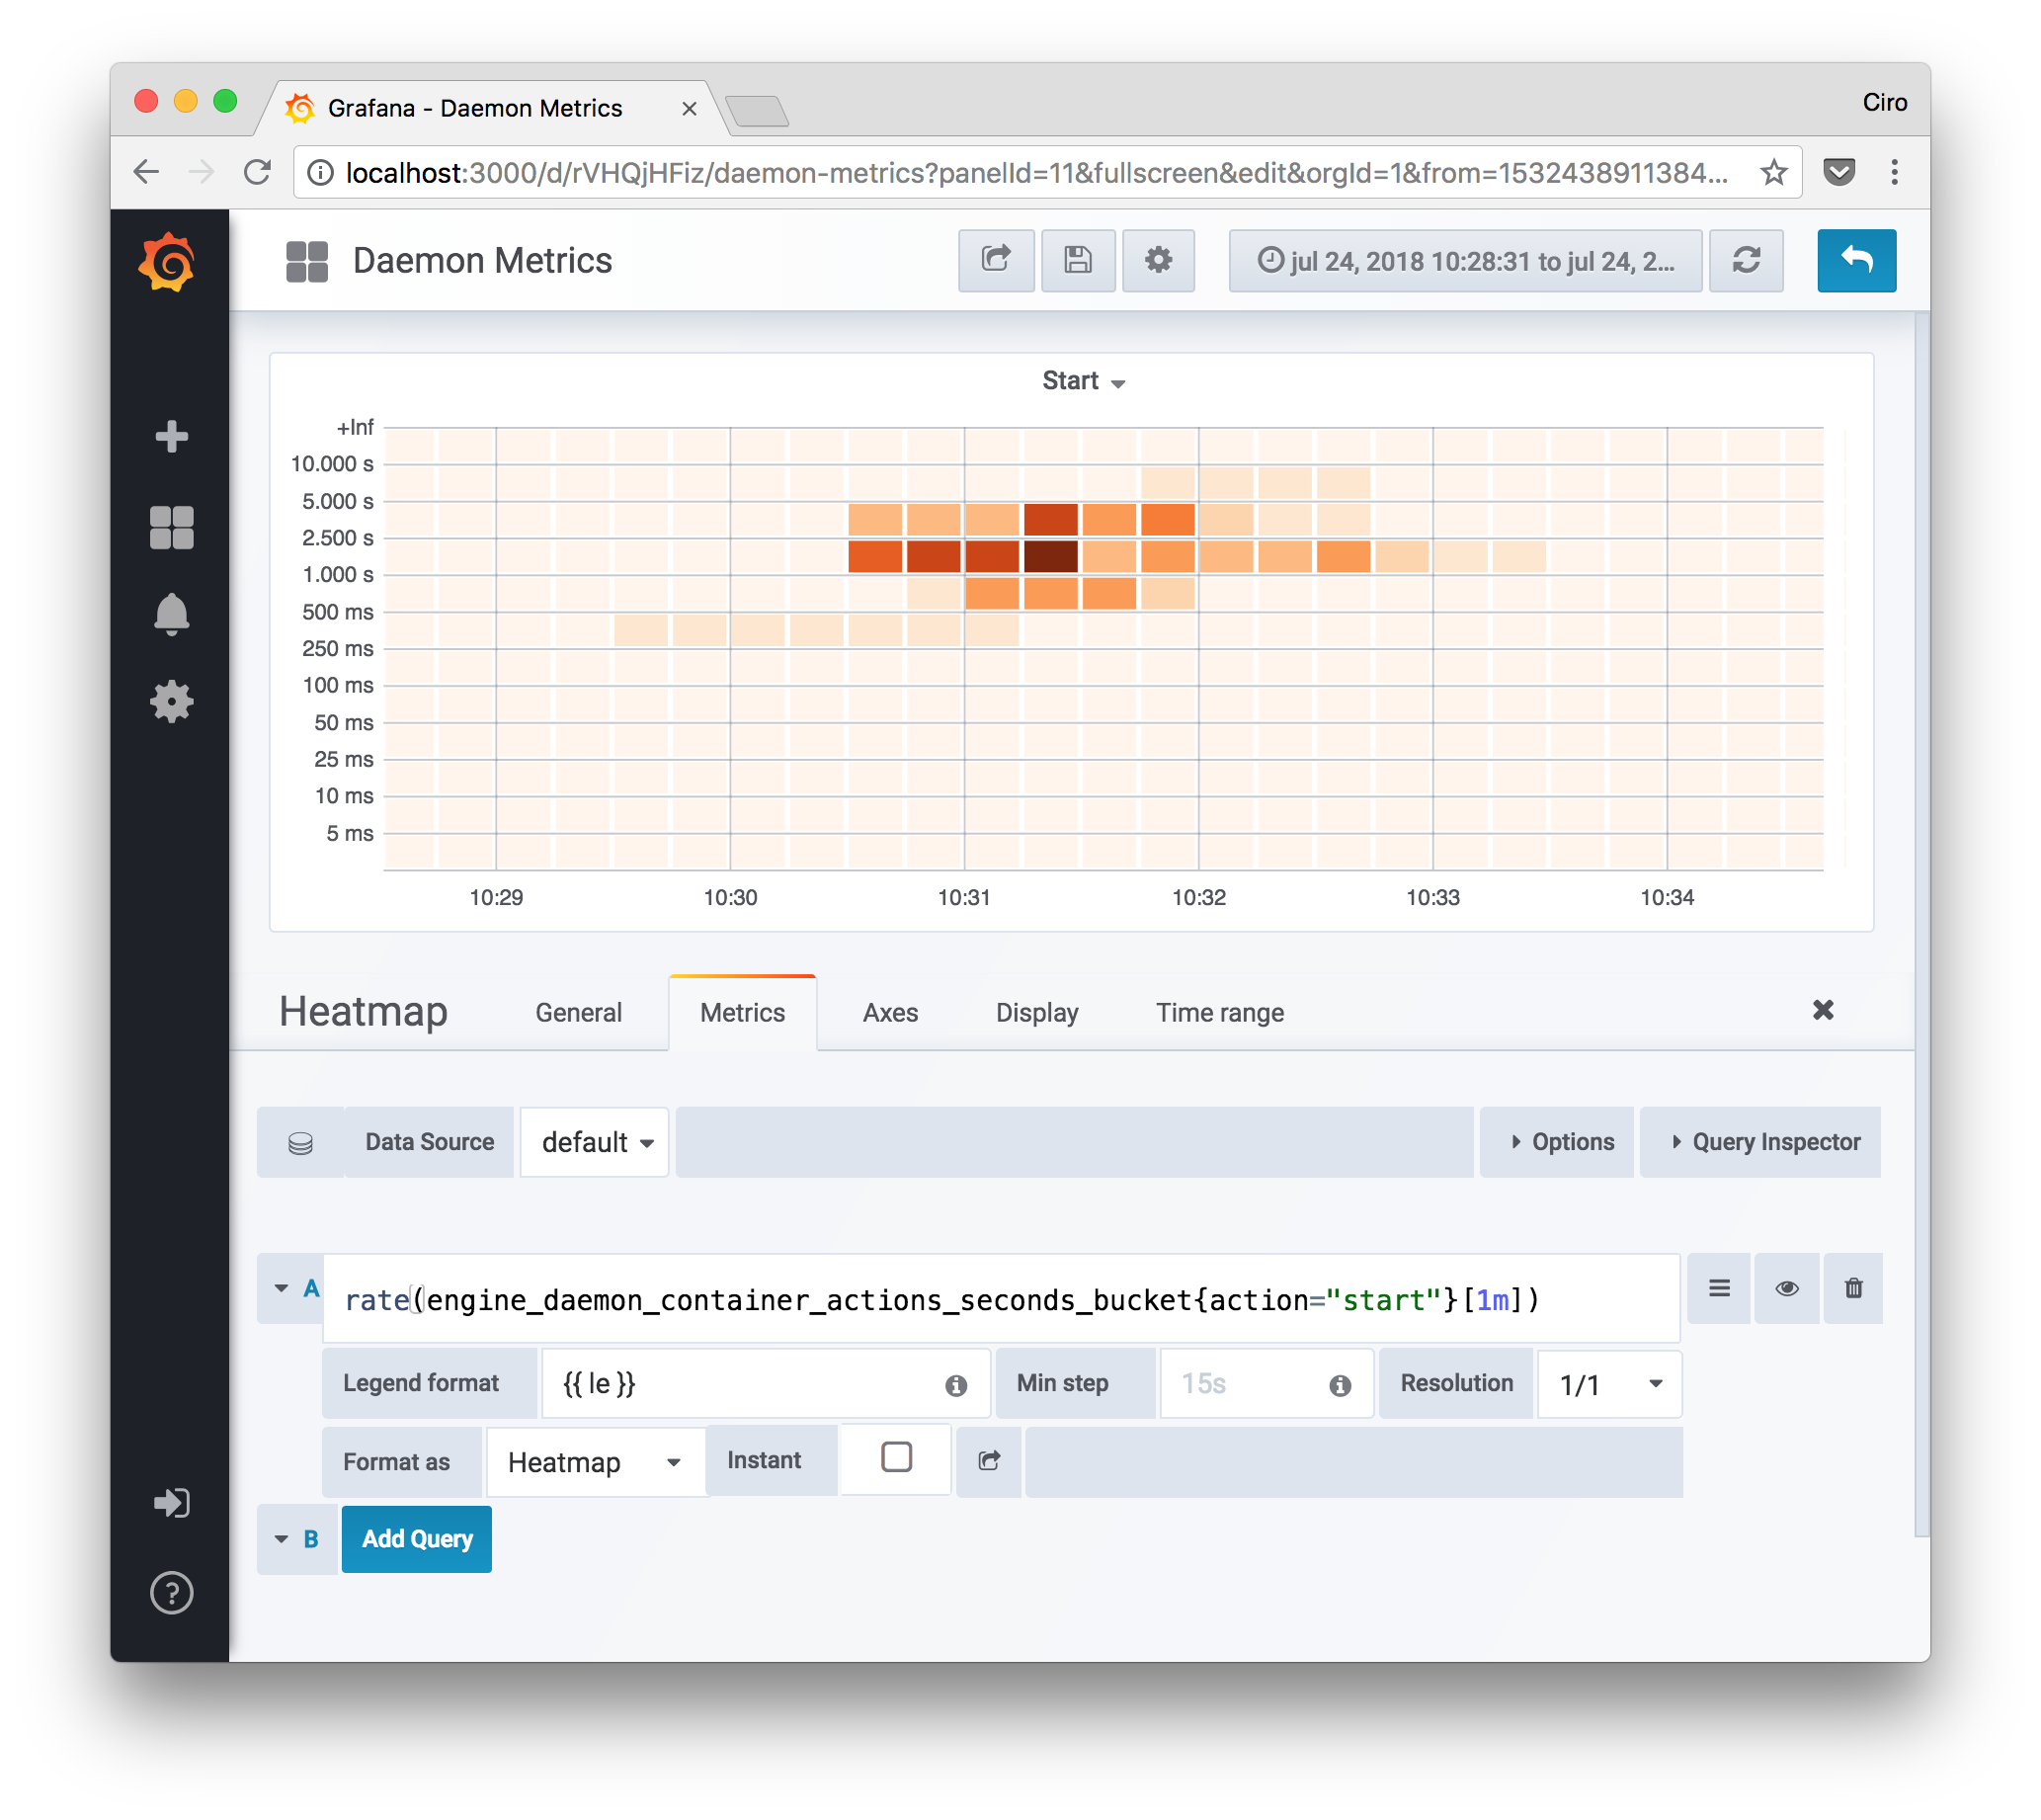
A handy type of metric that we can graph from the daemon metrics is heatmaps. With them, we can spot unusual spikes in actions that the Docker daemon performs.
From the Grafana documentation:
The Heatmap panel allows you to view histograms over time
Since Grafana v5.1, we’ve been able to make use of Heatmaps when gathering metrics from Prometheus instances (see this commit).

All that the query, in this case, is doing is:
- gathering all the Prometheus histogram buckets' values for the container action seconds metric labeled with the “start” action; then
- calculating the rate in a one-minute vector.
The second step is necessary to make the data non-commulative, such that we can see at which point the most significant start time happened.
Number of running Docker containers
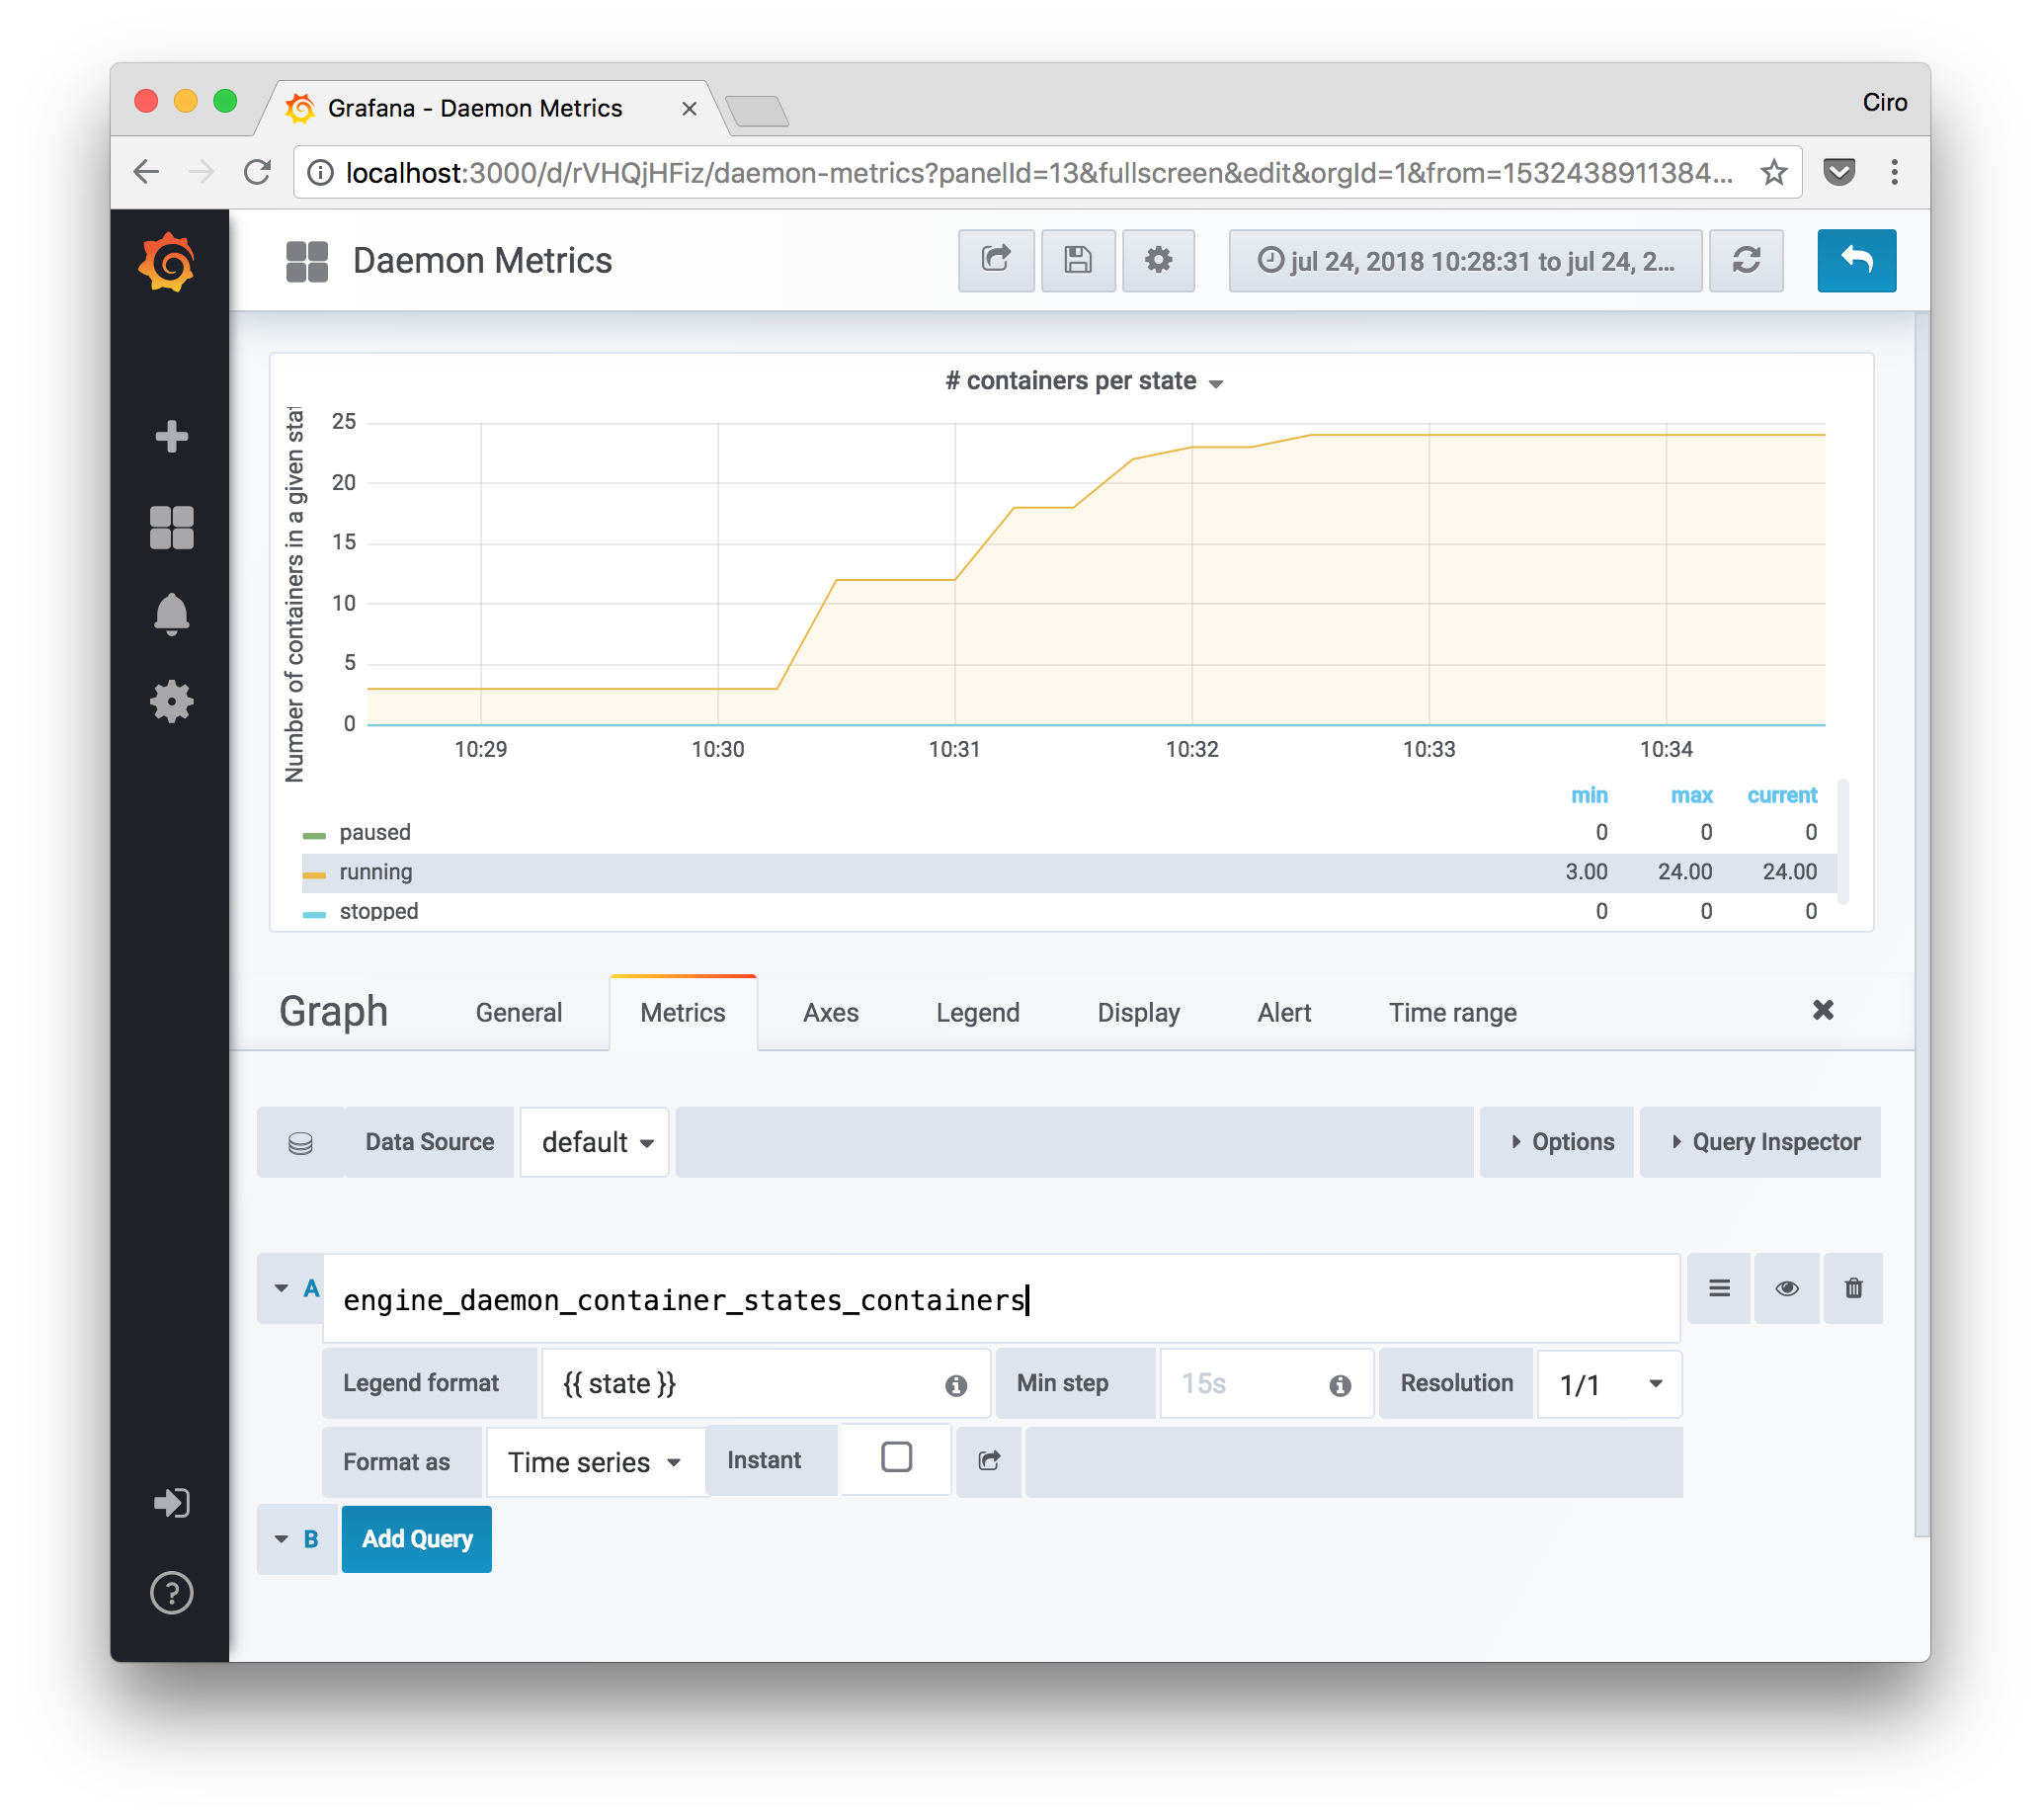
Another interesting type of metric that we can gather is gauge-like metrics that tell us about how many containers are being supervised by the daemon and in what states they are.
This can indicate how loaded the machine is. Differently from cAdvisor, here we can determine how many containers are indeed running, are still in create state, or even in a pause state.

Closing thoughts
By having the Docker daemon exporting its own metrics, we’re able to enhance even more the observability of the system when used in conjunction with cAdvisor.
While cAdvisor gives us the in-depth look of how the containers consume the machine resources, the Daemon metrics tells us how the daemon itself is consuming the machine resources and how well it’s performing what it should do - manage containers.
There are certainly more interesting metrics that you can gather, but I hope these ones will give you an idea of what’s possible.
If you enjoyed the article, please share it! I’d appreciate a lot!
You can also get related content by signing up to the newsletter below.
I’m also available for questions and feedback - hit me at @cirowrc any time.
Have a good one!
Ciro